
The Big Rotation
The recent rebound in the S&P 500 index is approaching a first area of resistance now. If it continues to roughly follow the 1962 analog which we have previously discussed (here is the chart), it should briefly back off, and then move slightly higher before rolling over again (we picked the analog because it featured a weak January open, and was preceded by a distribution phase in 1961 that looked very similar to the 2015 trading range; there is no other reason than pattern similarity, which has to be taken with a grain of salt).

We have actually been remiss in that we have failed to mention that Frank Roellinger informed us that the Modified Ned Davis Model has covered its Russell 2000 short position on Friday Feb. 26, and has switched back to a 100% long stance – however, readers hopefully caught our remarks published on the very same day:
“[W]e believe that the current market rebound could easily go further. Not only are there a number of historical patterns which suggest that market weakness in January is usually followed by a multi-week recovery, but the current positioning and sentiment backdrop also indicates that stocks should manage to trade firmer for a while.”
Now that the rebound has actually gone a bit further, we want to discuss its quality. There has been an improvement in market internals – mainly because previously beaten down sectors (such as transportation, industrial and commodity stocks) have begun to outperform the broader market. We have already briefly discussed some of the suspected reasons for this at the end of last week (stronger money supply and credit growth in China, and the cheapness of commodities in relative and absolute terms, regardless of still weak fundamental conditions).
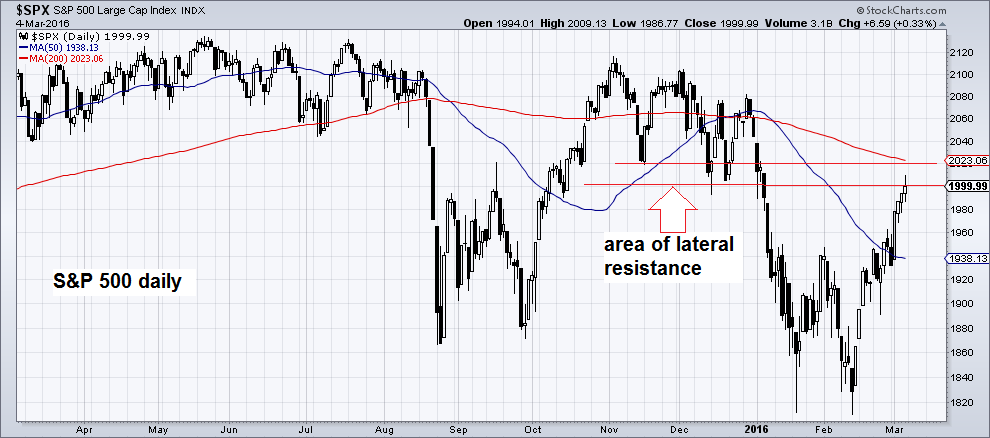
The S&P 500 index is approaching a lateral resistance area
Improving internals have gone hand in hand with rotation: this time, previously strong sectors are actually weak and lagging, especially technology stocks (including biotech stocks). When the market began to turn down in late December/ early January, the main beneficiaries were initially defensive sectors like utilities and consumer staples. A little later, a further shift in preferences has taken hold, with buyers rotating into the previously biggest losers, many of which have been beaten down to prices that are historically quite low. Here is a chart that is illustrating this theme nicely – it shows the ratio of XME to PNQI, i.e., the ratio of base metal mining stocks to internet stocks.


Leave A Comment