If you look at the yield curve since the early 80s double dip recession, what you’ll notice is that inversion – where 2-year rates exceed 10-year rates – precedes every recession. Right now, we’re still 70 basis points from inversion though. So far from expecting a slowdown or a recession, I would sooner expect economic acceleration. Let me go into detail below.
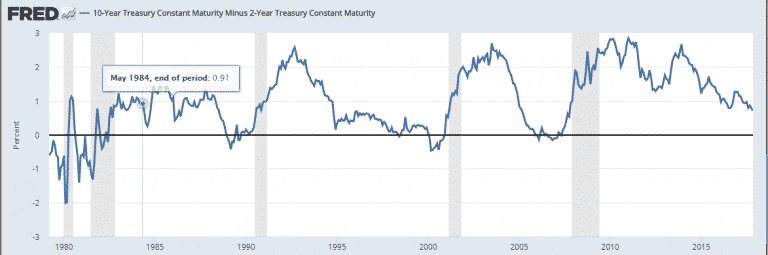
First, here’s the chart. It’s the 10-year constant maturity Treasury rate minus the 2-year rate. This spread is the most commonly cited one used to denote how flat or steep the yield curve is.

There are several distinct periods in the picture above.
During the double dip, the curve steepened dramatically from a near 200bps inversion to 100 basis points. This presaged recovery. But when the curve flattened once again and inverted,recession came soon after.
During the 1980s, the 2-10 spread was never steeper than 160bps. And it dipped dramatically twice, once in 1984 and again in 1986 without presaging a recession. It was only when the curve inverted in 1989 that recession came. And the delay between inversion and recession was about 16 months.
In the early 1990s, the curve steepened dramatically as the United States recovered from a commercial real estate bust and the Savings and Loan crisis. But when the Greenspan Fed raised rates unexpectedly fast, we almost had a recession. And the flattening of the yield curve matches that fact. Even after the recession was averted and the Goldilocks era began, the curve remained relatively flat all throughout the late1990s, briefly inverting during the Russian default and Long-Term Capital Management crisis. Only in March 2000, when the curve inverted more decisively, did recession follow.
Then, when the Fed brought rates down to 1% in the early 2000s, the curve steepened dramatically again – as much as it had in the early 1990s. But we saw a dramatic flattening starting in early 2004 as the Fed began to hike with the first inversion occurring in February 2006, a full 22 months before recession.
The last phase here began as the Fed cut rates to zero during the Great Financial Crisis. For the third decade in a row, we saw the curve steepen to a spread in excess of 250 basis points as recovery took hold. While the curve flattened to below 150 basis points in 2012, as the Fed poured on QE3 from September 2012 to December 2013, the curve steepened again to over a spread over 250 basis points before declining as the Fed withdrew accommodation.


Leave A Comment