
from the Chicago Fed
— this post authored by William A. Strauss and Thomas Haasl
According to participants in the Chicago Fed’s annual Automotive Outlook Symposium, the nation’s economic growth is forecasted to be near its long-term average this year and to strengthen somewhat in 2018. Inflation is expected to increase in 2017 and to hold steady in 2018. The unemployment rate is anticipated to edge lower to 4.4% by the end of 2017 and to remain at that rate through 2018. Light vehicle sales are predicted to decrease from 17.5 million units in 2016 to 17.1 million units in 2017 and then to 16.9 million units in 2018.

The Federal Reserve Bank of Chicago held its 24th annual Automotive Outlook Symposium (AOS) on June 1 – 2, 2017, at its Detroit Branch. More than 60 economists and analysts from business, academia, and government attended the AOS. This Chicago Fed Letter reviews the forecasts from last year’s AOS for 2016, and then analyzes the forecasts for 2017 and 2018 (see figure 1) and summarizes the presentations from this year’s AOS.
The U.S. economy continued to expand from the longest and deepest drop in economic activity since the Great Depression. During the 31 quarters following the end of the Great Recession in mid-2009, the annualized rate of real gross domestic product (GDP) growth was 2.1% – near what is considered the long-term rate of growth for the U.S. economy. This GDP growth rate is very disappointing, since typically, the pace of economic recovery/expansion is quite sharp following a deep recession.
While the economy’s expansion has lasted nearly eight years, signs of slack still remain in the economy. The unemployment rate moved down to 4.3% in May 2017, below prominent estimates of the natural rate of unemployment (i.e., the rate that would prevail in an economy making full use of its productive resources). However, several other labor market indicators suggest that some degree of slack remains in the employment market. First, the labor force participation rate has fallen over the past several years somewhat below what demographic changes of an aging population can explain. Second, the percentage of workers who are working at part-time jobs but desire full-time employment is still above what it has historically averaged. And third, the pool of unemployed workers who have been out of work for more than six months remains at levels that are exceptionally high – higher than anything seen since the Great Depression.
1. Median forecast of GDP and related items
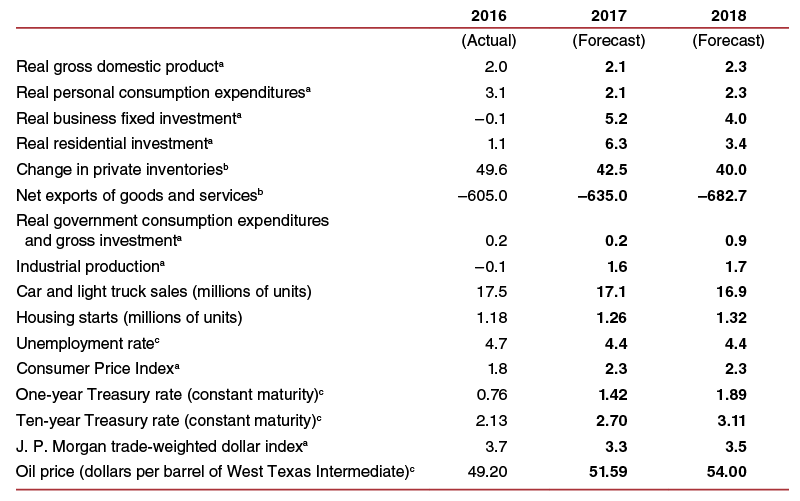
aPercent change, fourth quarter over fourth quarter.
bBillions of chained (2009) dollars in the fourth quarter at a seasonally adjusted annual rate.
cFourth quarter average.
Note: These values reflect forecasts made in May 2017.
Sources: Actual data from authors’ calculations and Haver Analytics; median forecasts from Automotive Outlook Symposium participants.
In addition to the persistent slack, there have been two big shocks whose effects have reverberated across the U.S. economy over the past three years. First, the average price of oil, which stood at $106 per barrel in June 2014, collapsed later that year, reaching $59 per barrel in December 2014. The average price of oil eventually bottomed out in February 2016 – at $31 per barrel. As of May of this year, it had risen to nearly $49 per barrel. The decline in energy prices has had both positive and negative impacts on the U.S. economy. On the positive side, users of energy have enjoyed a substantial reduction in their costs of purchasing energy. The primary beneficiaries have included consumers, manufacturers, and the transportation sector. However, over the past nine years, the United States has become a significantly larger producer of energy, and hence, the loss of income to the domestic energy sector now leads to a greater negative impact than it historically has.
Second, the real value of the U.S. dollar in international exchange markets had strengthened substantially since the summer of 2014, rising nearly 22% through January 2017. The real trade-weighted value of the U.S. dollar fell 3.4% over the following four months, but remained strong. The higher value of the U.S. dollar against foreign currencies has had a dramatic impact on trade and, hence, the U.S. economy’s growth. A strengthening dollar makes U.S.-made goods more expensive to foreign customers, thus reducing the demand for such goods from abroad and lowering the growth of exports. It also makes foreign-made goods less expensive to U.S. purchasers, thus increasing the demand for such goods here and raising the growth of imports. So, given the significantly stronger dollar, it’s no surprise that the United States saw its trade deficit increase in 2016, amounting to a 0.2 percentage point drag on the growth rate of real GDP.
With the diminishing slack in the economy and higher energy prices over the past year, inflation has moved higher. Inflation, as measured by the Consumer Price Index (CPI), was extremely low at 0.4% in 2015 – the lowest rate since 1955; it moved up to 1.8% in 2016, and by May 2017, the year-over-year rate of inflation had inched up to 1.9%.


Leave A Comment