
Friday’s release of the publicly available data from ECRI puts its Weekly Leading Index (WLI) at 143.9, down from the previous week. Year-over-year the four-week moving average of the indicator is now at 4.36%, down from 4.63% last week. The WLI Growth indicator is now at 1.9, also down from the previous week.
“Finding the Root Cause of Recessions”

ECRI’s latest headline article digs into the causes of recent recessions after the 2008 financial crisis. Specifically, comparisons are made between US and Japanese economic growth, economic vulnerability, and exogenous shocks. ECRI concludes that while US GDP has been extremely low since the Great Recession, no recession has occurred due to a lack of exogenous events.
The ECRI Indicator Year-over-Year
Below is a chart of ECRI’s smoothed year-over-year percent change since 2000 of their weekly leading index. The latest level is above where it was at the start of the last recession.

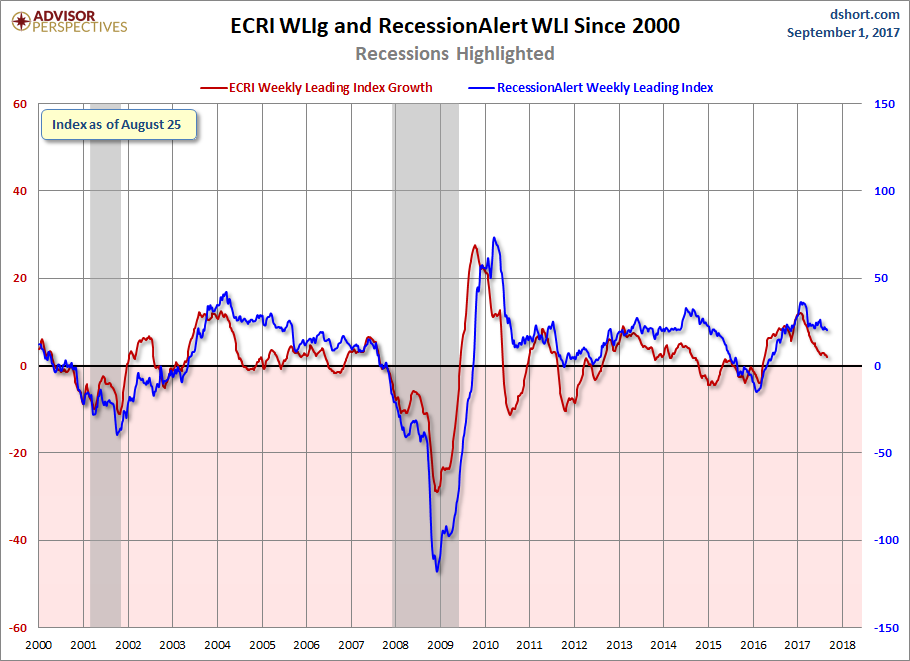
RecessionAlert has launched an alternative to ECRI’s WLIg, the Weekly Leading Economic Indicator (WLEI), which uses 50 different time series from various categories, including the Corporate Bond Composite, Treasury Bond Composite, Stock Market Composite, Labor Market Composite, and Credit Market Composite. An interesting point to notice — back in 2011, ECRI made an erroneous recession call, while the WLEI did not trigger such a premature call. However, both indicators are now generally in agreement and moving in the same direction.
Appendix: A Closer Look at the ECRI Index
The first chart below shows the history of the Weekly Leading Index and highlights its current level.

For a better understanding of the relationship of the WLI level to recessions, the next chart shows the data series in terms of the percent-off the previous peak. In other words, new weekly highs register at 100%, with subsequent declines plotted accordingly.

Related Posts
 Stocks Outlook – Thursday, Oct. 25
 Stocks Fall On Trade War Jitters
- 17 Firms Going Ex-Dividend Next Week, Including Oracle, Apache And CVS
- Buy-Ranked Mid-Cap ETFs For A Shaky Market
- ECRI Weekly Leading Index Update – August 10, 2018
- End Of Fed Independence. House Financial Services Committee Sends Warning Letter To Yellen “This Is Unacceptable”


Leave A Comment