

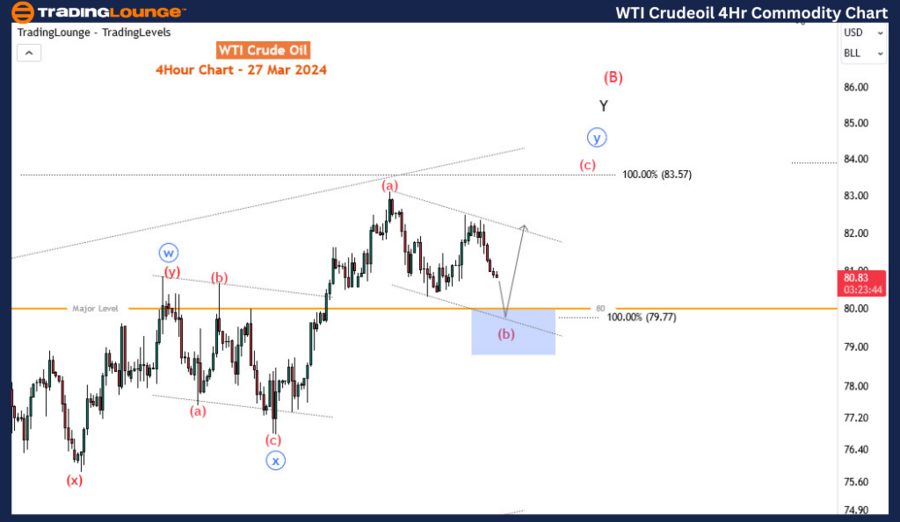
WTI Elliot Wave Analysis Function – Counter-trend Mode – Corrective Structure – Zigzag Position – Wave (b) of ‘y’Direction – Wave (b) of ‘y’ is still in playDetails – A pullback for (b) is happening as expected. Wave (b) is expected to find support at 80 -79 inside the blue zone. Wave (c) should begin from there. Since mid-December 2023, WTI has been ascending in a corrective manner. During this period, the commodity has gained approximately 20%. However, taking a broader perspective, the bullish correction is expected to conclude, and the bearish trend that began in September 2023 will likely continue downward, potentially dipping below $67 and even further to $64.5, or at least correcting to a range of $75 to $70.Meanwhile, focusing on the corrective rally from mid-December once again, it appears that we may experience one more upward movement to $83.5 or possibly higher before the overarching bearish trend resumes. In this commodity blog post, we aim to identify where the next opportunity lies along the path of the corrective rally from mid-December before its culmination.On the daily chart, the decline from 130.9 (the top in March 2022) seems to be unfolding into a double zigzag pattern. Wave W (depicted in blue) concluded at 64.5 in March 2023, followed by a rally for wave X (also in blue) which terminated at 95 in September 2023. Subsequently, the downward movement that has been unfolding appears to be wave Y (in blue). Focusing on wave Y, it is anticipated to complete a three-swing move similar to the first two legs. Wave (A) ended in December 2023 and the subsequent rally from 67.8 is considered wave (B). Delving into wave (B), it seems to be forming a double zigzag, with waves W and X already completed and wave Y nearing its terminus. It is speculated that wave Y could extend to 83.5-84, which corresponds to a 100% extension of W from Y. Furthermore, upon examining the sub-waves of Y from the H4 time frame, it appears that we may witness one more upward movement.On the 4-hour time frame, wave Y is unfolding as a double zigzag. Presently, it is in wave (b) of Y. Attention should be directed towards wave (b), which is completing a double three (zigzag) pattern. Wave (b) could find support around the major level of 80 or slightly below, within the blue zone (ranging from 80 to 79). Following this, there might be renewed buying interest for wave (c), potentially culminating higher around 83.5-84, where the bullish run that began in December 2023 might conclude.Technical Analyst : Sanmi Adeagbo
 More By This Author:Elliottwave Technical Analysis: Binance Coin Crypto News
Commodity Outlook: Metals & Cryptocurrencies
Elliott Wave Technical Analysis: Johnson & Johnson – Tuesday, March 26


Leave A Comment