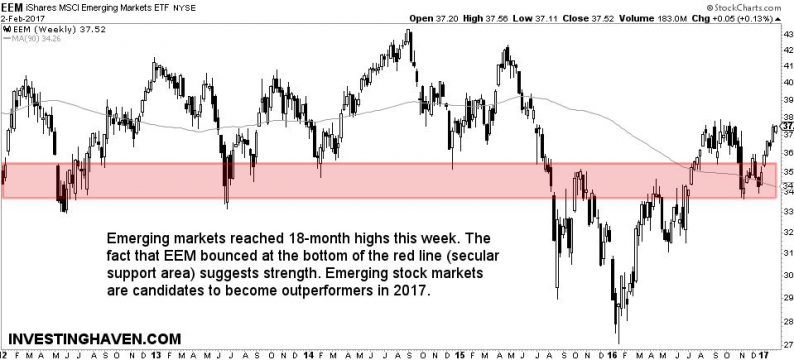
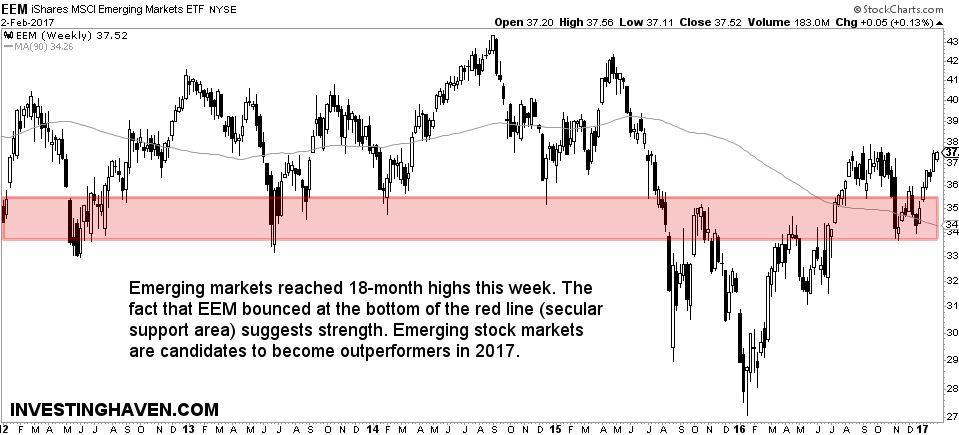
Emerging stock markets reached 18-month highs this week. It seems emerging markets (EEM ETF) are well on their way to test 43 points which is the higher target of InvestingHaven’s research team, as explained in An Emerging Stock Markets Forecast for 2017.
EEM ETF, representing emerging stock markets, closed at 37.52 points today.
The fact that EEM bounced at the bottom of the red line (secular support area) suggests strength.
Emerging stock markets are candidates to become outperformers in 2017. Why? Because they have been consolidating for such a long period of time. The very long term emerging stock markets chart makes that point. After a 9-year consolidation period, it seems about time that this market segment takes leadership again.
Typically, a lot energy is gathered during such a long time period. The general rule is that the longer the chart formation the stronger the uptrend or downtrend afterwards.
Visibly, the line in the sand for emerging stock markets is 42 points in the EEM ETF. Emerging markets are now some 10 pct below secular resistance. InvestingHaven’s research team strongly believes that, “if the 42 level would be broken, we would see an extremely bullish period for emerging markets.”
As always, the key success factor for investors is to look for the leaders in that market segment. Based on price analysis, it is clear that India, followed by China, are the most favorable candidates to be sector leaders. Moreover, Russia seems to have broken out strongly.
Investors are watching closely what happens at 37 points, but, more importantly, at 42 points in the EEM ETF.


Leave A Comment