
What a difference a week can make. In our Chart of the Day on August 15th, we noted that extreme oversold conditions (over 3 standard deviations below the 50 day moving averages) in the Energy sector had historically been a bullish signal in the near-term. Below we include the key data from that note.
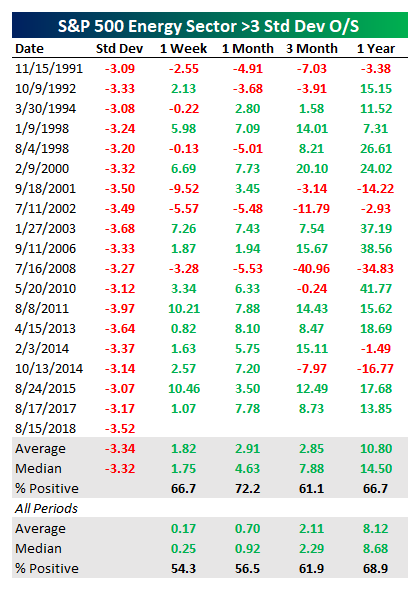
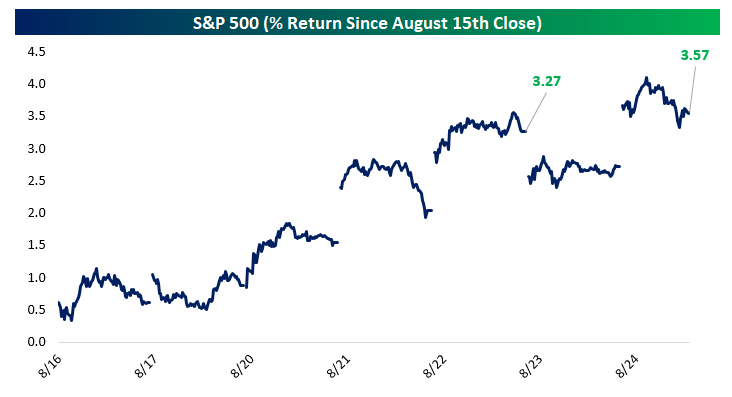
As shown in the chart below, the 3.27% gain over the week following the close on the 15th was even stronger than the 1.82% average for historical Energy sector bounces. As of today, the Energy sector is up over 3.5% from the >3 standard deviations oversold close last week. As shown in the table above, the longer-term outperformance from the lows tends to deliver solid outperformance as well.


Leave A Comment