
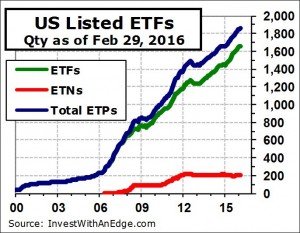
Thirteen new products came to market in February: seven exchange-traded funds (“ETFs”) and six exchange-traded notes (“ETNs”). Closures were on the light side, with just three products being liquidated during the month. The net increase of 10 listings pushes the overall count to 1,863, consisting of 1,659 ETFs and 204 ETNs. Assets declined for the third consecutive month and now total $2.02 trillion.
In January, three ETNs encountered early terminations. Some of the February introductions were intended to replace those previously terminated ETNs. Two UBS ETRACS ETNs providing leveraged exposure to master limited partnerships (“MLPs”) fell victim to their own anti-ruination triggers on January 20 due to the steep price plunge among MLPs. These two ETNs were liquidated on February 1, and eight days later, UBS rolled out their replacements: ETRACS 2xMonthly Leveraged Alerian MLP Infrastructure Index Series B ETN (MLPQ) and ETRACS 2xMonthly Leveraged S&P MLP Index Series B ETN (MLPZ).
ProShares also brought out a replacement product in February. However, unlike UBS, which rushed to fill the gap created by prior terminations, ProShares brought out its “new and improved” version before its predecessor disappeared. ProShares Managed Futures Strategy (FUT), launched 2/18/16, is a more shareholder-friendly version of the existing ProShares Managed Futures Strategy (FUTS). The major difference between the two is that the new FUT will issue 1099s at tax time, while FUTS has been issuing K-1 forms. The underlying structural and regulatory differences prevented ProShares from a merger or simple transformation of the “old” into the “new.” Therefore, ProShares went with a “launch one and close the other” plan and provided shareholders with a one-month overlap.
An event occurred in February that you will not see in our statistics. On February 26, 2016, the NASDAQ began listing Eaton Vance Stock NextShares (EVSTC). You may have read some articles declaring these to be the next generation of actively managed ETFs. Technically, they are classified as exchange-traded managed funds (“ETMFs”), and ETMFs are not ETFs.
For starters, the U.S. Securities and Exchange Commission has placed some tough restrictions on ETMF advertising. Namely, ETMF sponsors and issuers
There you have it. They are not ETFs and will not be included in our ETF statistics at this time. Additionally, they are not mutual funds or open-end investment companies either. They are ETMFs with their own unique set of order types (buy at a future net asset value [“NAV”] plus premium, sell at a future NAV minus discount) and only one broker (Folio Investing) that can currently process these strange orders.
The quantity of ETFs with more than $10 billion in assets grew from 51 to 53 in February, and these vital few hold 59.9% of industry assets. The number of products with at least $1 billion in assets increased from 243 to 246. The median asset level is just $61.5 million, which is a far cry from the “average” level of $1.09 billion. Trading activity slid 13.9% lower for the month to $1.87 trillion, reflecting a 92% turnover ($ volume/industry assets) for the month.


Leave A Comment