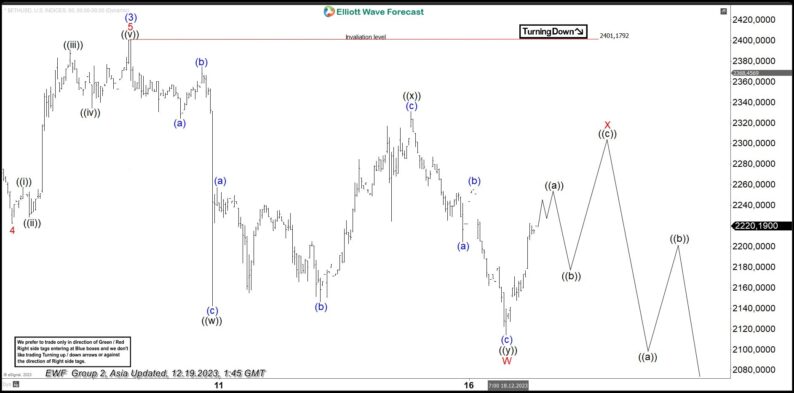
Short Term Elliott Wave View in Ethereum (ETHUSD) shows that it has ended wave (3) at 2401.18. Pullback in wave (4) is currently in progress as a double three Elliott Wave structure. Down from wave 93), wave (a) ended at 2324.3 and wave (b) ended at 2374.78. Wave (c) lower ended at 2142.28 which completed wave ((w)). The crypto currency then corrected in wave ((x)) as a zigzag structure. Up from wave ((w)), wave (a) ended at 2257.38 and wave (b) ended at 2146.35. Wave (c) higher ended at 2331.34 which completed wave ((x)).The crypto-currency then turned lower in wave ((y)). Down from wave ((x)), wave (a) ended at 2204.42 and wave (b) ended at 2255.08. Wave (c) lower ended at 2114.22 which completed wave ((y)) of W. Ethereum is now correcting cycle from 12.9.2023 high in wave X as a zigzag structure. Up from wave W, wave ((a)) is expected to end soon, then it should pullback in wave ((b)), followed by further upside in wave ((c)) of X. Then, as far as pivot at 2401.18 high remains intact, the crypto-currency has scope to see further downside in a larger double three in wave Y. Ethereum (ETHUSD) 60 Minutes Elliott Wave Chart 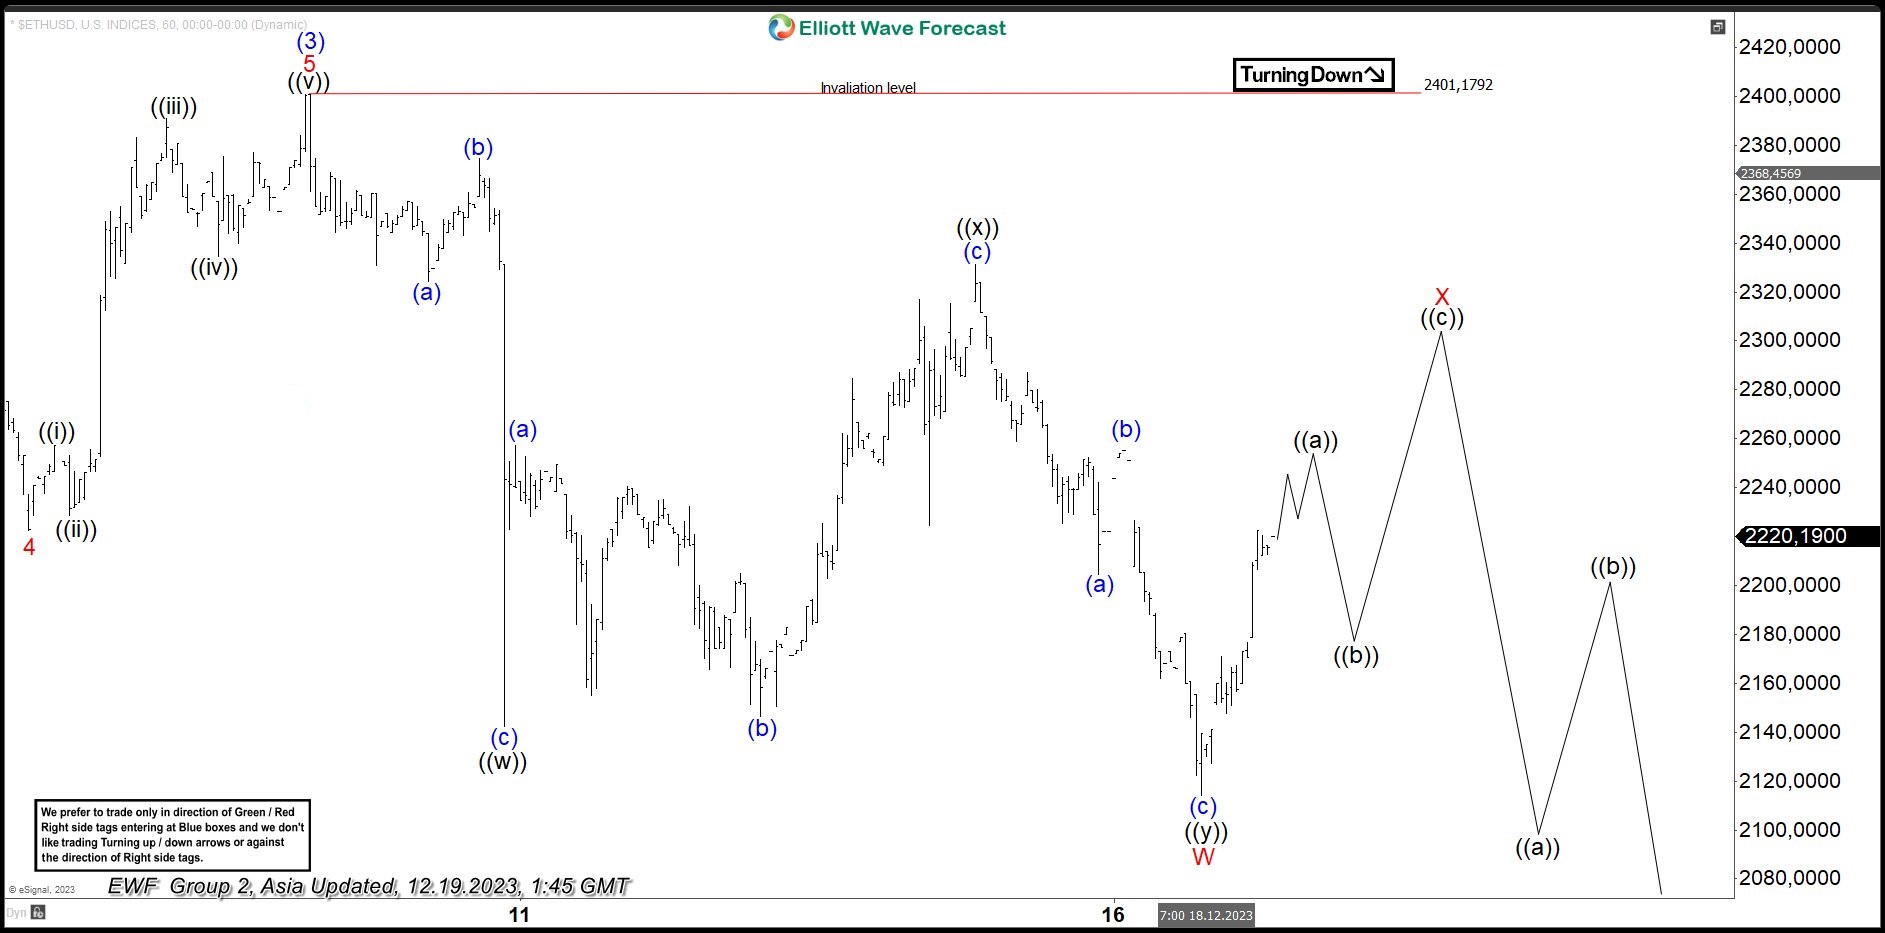 More By This Author:Apple Keeping The Momentum & Reacting Higher From Blue Box AreaAmerican Express Is Heading To A Potential Selling Area GBPUSD : Catching The Move Lower


Leave A Comment