
EUR/USD
4 hour

The EUR/USD broke above the triangle (dotted orange) and is expanding the bullish correction, which makes it more likely that a continuation of the daily triangle via wave d-e (green) is occurring. For the moment this correction has been labelled WXY (brown).
1 hour

The EUR/USD breakout above resistance (red) has seen price move towards the Fib targets as part of a wave C (blue). At the moment a wave 3-4 (green) could still be taking place within wave C (blue) as long as price stays above the 61.8% Fibonacci retracement level and support trend line (green).
GBP/USD
4 hour

The GBP/USD is building a triangle (red/green lines) as part of a WXY (blue) correction within wave 4 (green). Once wave 4 (green) is completed, a downtrend continuation is expected to push below support for wave 5 (blue).
1 hour

The GBP/USD is in a large consolidation and could continue to build zigzags between support and resistance. A break above or below support or resistance lines could indicate a potential for price to move towards Fib targets or continue with the larger trend.
USD/JPY
4 hour
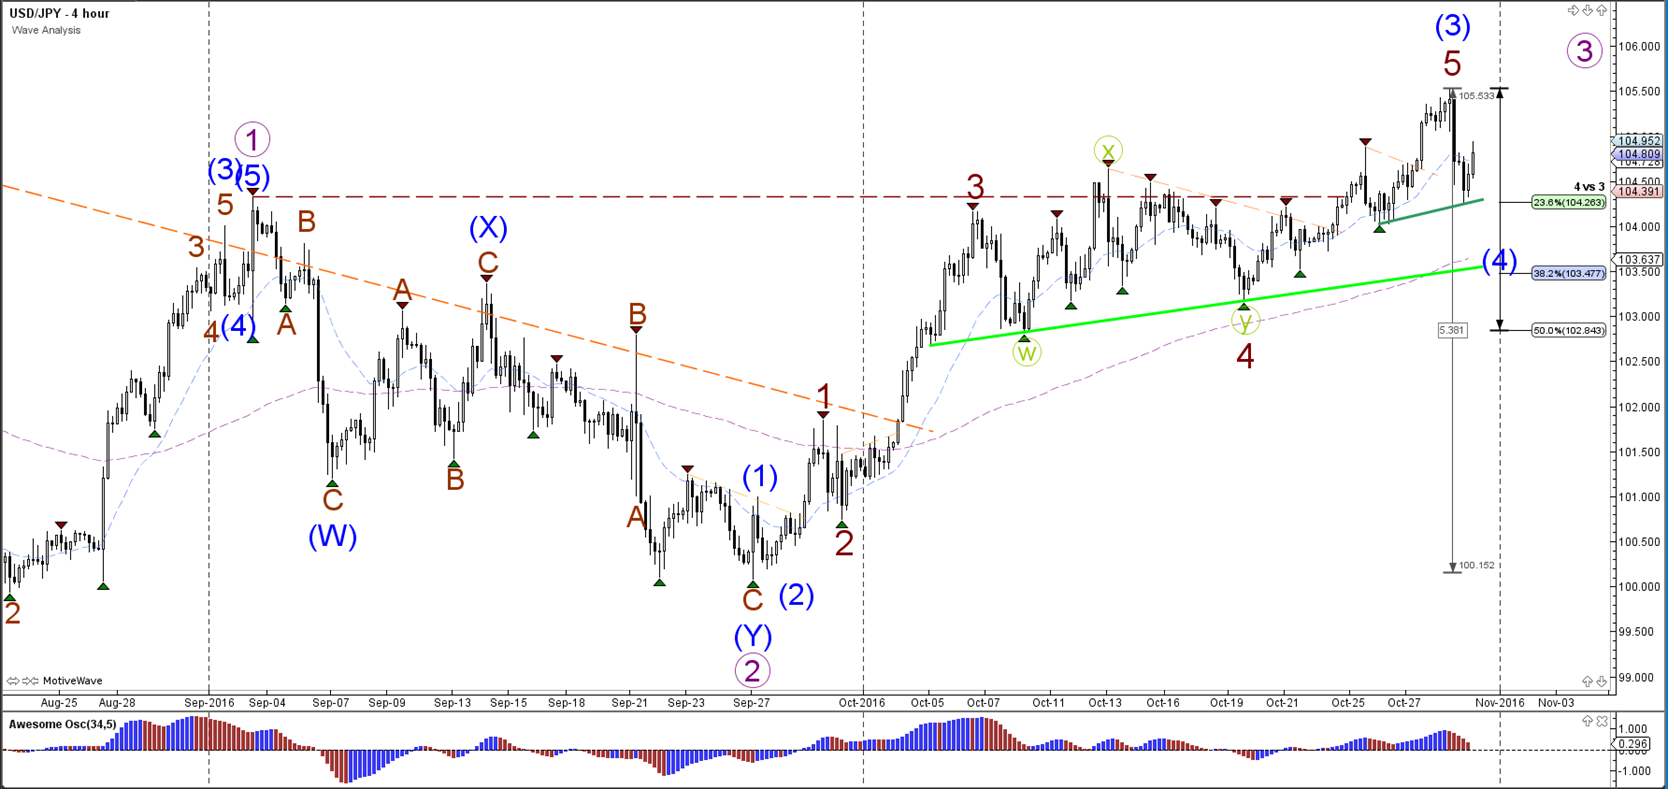
The USD/JPY uptrend saw a sturdy pullback last week but price is still above shallow Fibonacci levels of wave 4 (blue). As long as price stays above the 50% Fib a wave 4 correction (blue) seems likely.
1 hour

The USD/JPY could be building a larger expanding correction within wave 4 (blue) via an ABC (brown). A bullish bounce at the 38.2% Fibonacci level seems likely. If price does not make a deeper retracement to the 38.2% Fib, then I would expect a triangle formation (purple arrows) to emerge. A break above the top could also indicate a breakout.


Leave A Comment