
EUR/USD
4 hour

The EUR/USD broke below the long-term support trend line (green), which could be explained via a continuation of wave C (blue) or alternatively a wave 3 if price expands below the 161.8% Fibonacci target.
1 hour

The EUR/USD broke below the support trend line (dotted green) and made a bearish breakout. The bullish corrections have been weak so far which makes a wave 4 (orange) likely unless price breaks above the 61.8% Fibonacci level of wave 4 vs 3.
GBP/USD
4 hour

The GBP/USD broke one of the long-term support trend lines (dotted green) and confirms a downtrend continuation. The ABC could also turn out to be a 123 if price can break below the long-term trend support (dark green).
1 hour
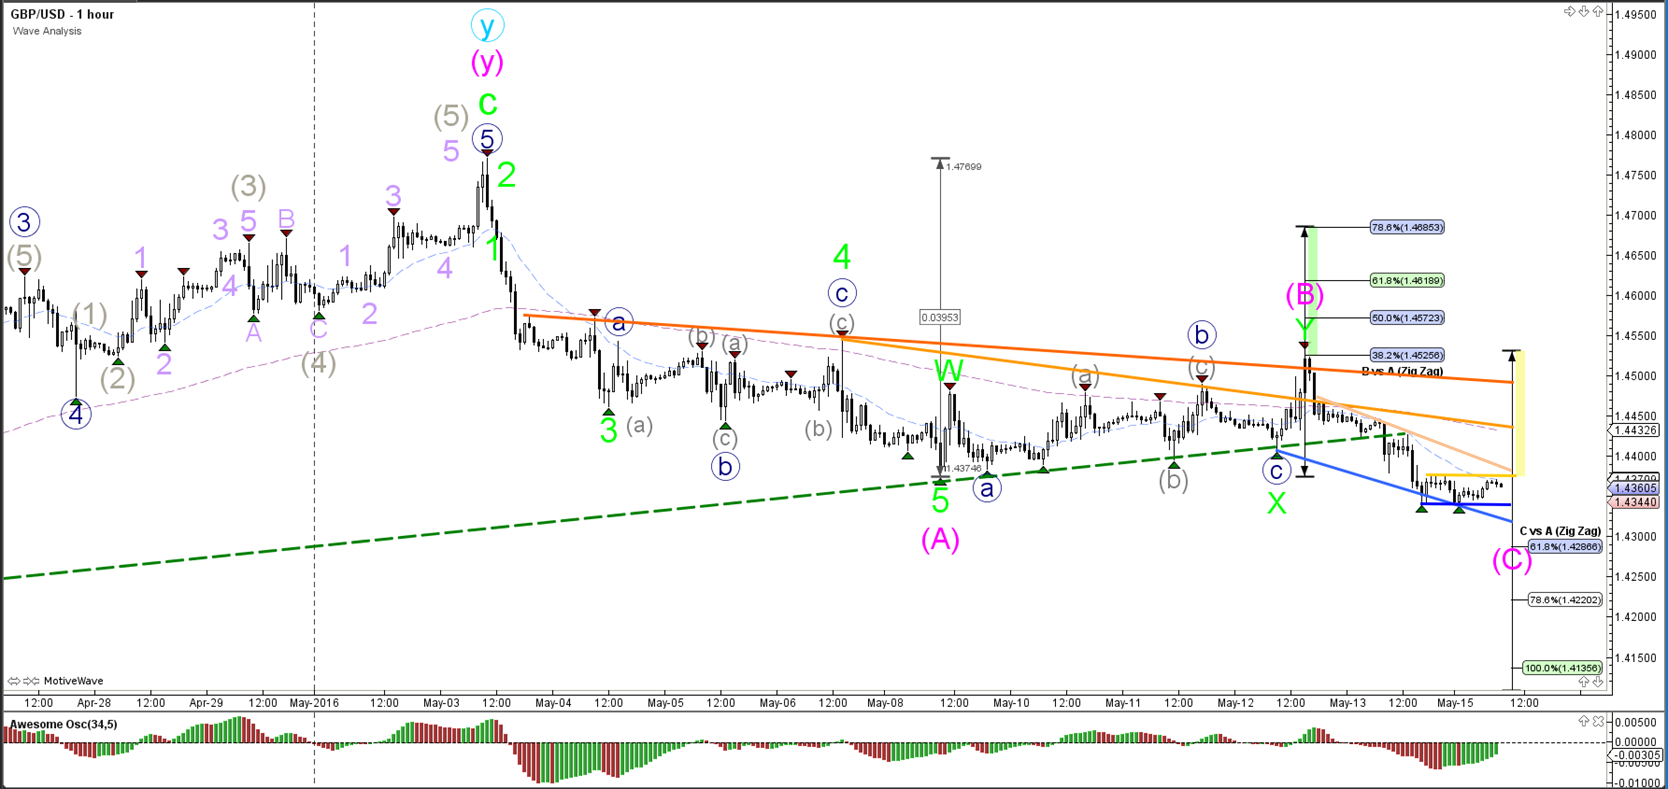
The GBP/USD is building a bear flag chart pattern (yellow-blue). A bullish break above resistance (red-orange) could change the wave count. A break below support (blue) should see price head towards the Fibonacci targets of wave C vs A.
USD/JPY
4 hour

The USD/JPY break above the 161.8% Fibonacci target favors a wave 3 (purple) whereas a bearish break below the support trend line (blue) makes a wave C (pink) more likely.
1 hour

The USD/JPY completed an ABC correction most likely within wave 4 (grey). A break above resistance (orange) could start a wave 5 (orange) whereas a break below support (blue) favors a bearish breakout and a wave 5 (orange) which was completed at the recent highs.


Leave A Comment