
EUR/USD is in retreat but price continues to hold within the monthly range. The recent sell-off is now approaching initial support targets with a move lower to ultimately offer more favorable buying opportunities.
EUR/USD DAILY PRICE CHART
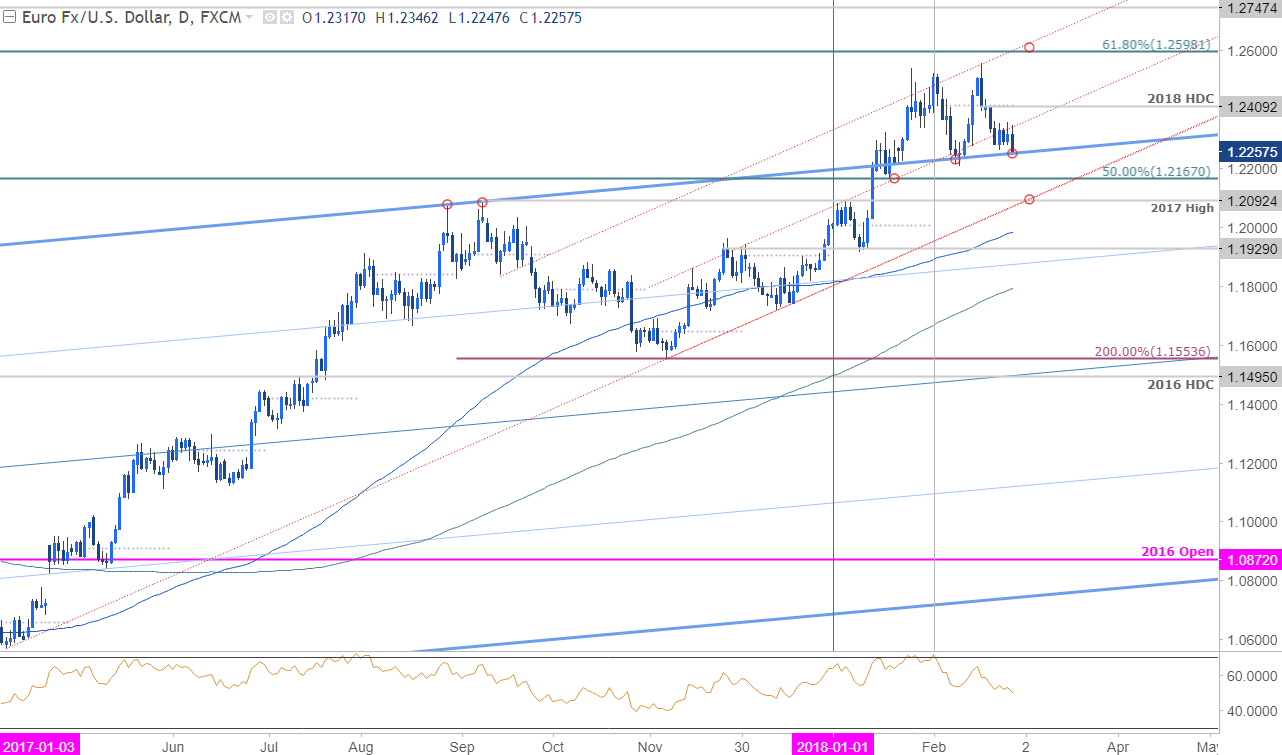
Technical Outlook: EUR/USD has carved out a well-defined monthly opening range just above former slope resistance, now support. Price has continued to trade within the confines of a series of ascending slope lines originating off the April lows and keeps the broader focus higher while above the 2017 high at 1.2092(bullish invalidation). Daily resistance stands with the monthly / yearly high-day close at 1.2409 with a breach there targeting the long-term 61.8% retracement of the 2014 decline at 1.2598.
EUR/USD 120MIN PRICE CHART
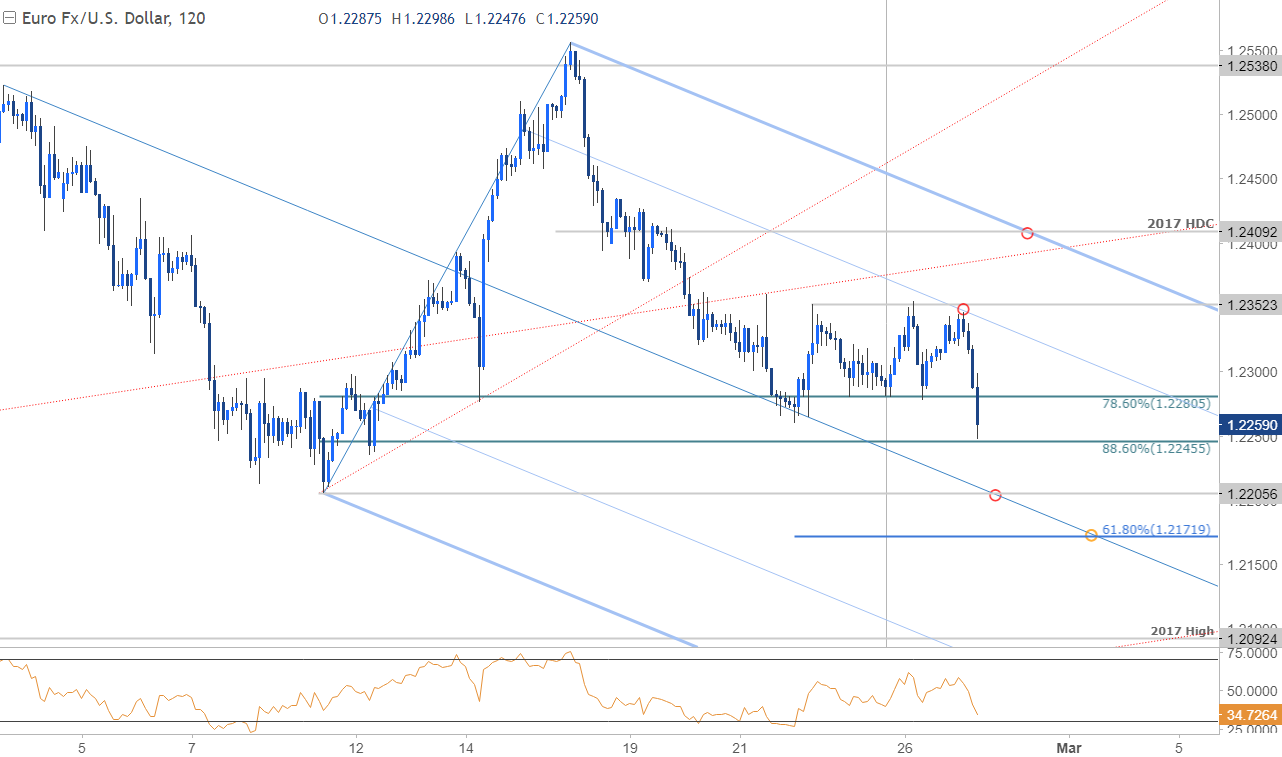
Notes: A closer look at EURUSD price action sees the pair trading within the confines of a near-term descending pitchfork formation extending off the February highs, with a break of the weekly opening-range shifting the immediate focus lower. That said, we’re looking for a possible exhaustion low on a move towards support objectives at 1.2206 & 1.2172– both levels of interest for long-entries IF reached.
Look for interim resistance back at 1.2281backed by the 61.8% line of the descending slope pattern / weekly opening-range high at 1.2352. A breach/close above confluence resistance at 1.2409 would be needed to mark resumption of the broader uptrend with such a scenario targeting January high at 1.2538 and 1.2598.
Bottom line: Looking for signs of exhaustion on a move lower here with the decline to offer more favorable long-entries targeting a breakout of this formation. Keep in mind there’s a good amount of event risk on tap still this week with the Eurozone Consumer Price Index (CPI) and the second read on US 4Q GDP figures on tap tomorrow.


Leave A Comment