
In this series, we scale-back and take a look at the broader technical picture to gain a bit more perspective on where we are in trend. Euro responded to a key technical support confluence late-last month with the first day of November trade on pace to post the largest single-day advance since late-September. Here are the key targets & invalidation levels that matter on the EUR/USD weekly chart.
EUR/USD WEEKLY PRICE CHART
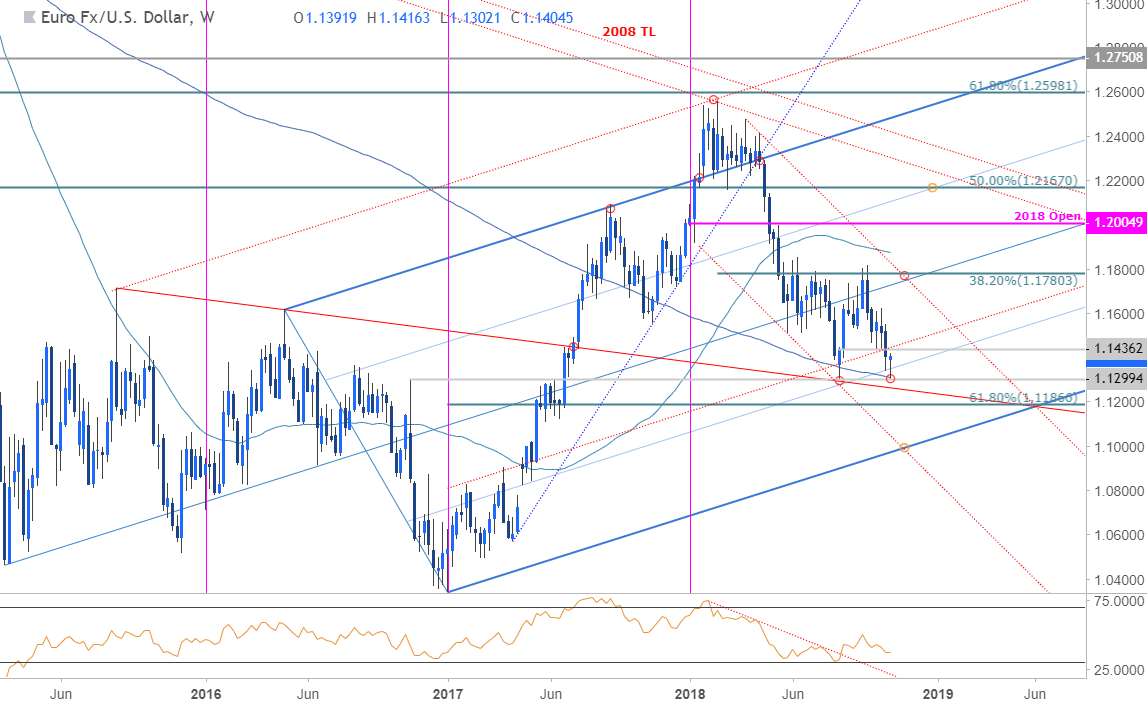
Notes: In October’s EUR/USD Weekly Technical Perspective, we examined the threat of further losses for the Euro with our ‘bottom line’ noting that, “A break / close below (1.1498) would invalidate the reversal play with such a scenario targeting the yearly low-week close at 1.1436 backed by the 200-week moving average/slope support at ~1.1330 and the 1.13-handle.” A late-break of the monthly opening-range lows fueled accelerated losses with price registering a low at 1.1302 on the last day of October trade. So was that a final washout?
The jury is still out, but there are some interesting technicals observations to consider. Note that the US Dollar Index (DXY) registered a fresh yearly low this week while EUR/USD did not (neither did GBP/USD for that matter). This divergence in price is often exhibited at major market turns/reversals and increases the threat of price exhaustion. Also, note that sentiment has reversed from extremes in net-long positioning not seen since April 2017- which ended up being the origin of the 2017 advance.
While these observations are quite compelling, it doesn’t mean the bulls are out of the woods just yet. A break / weekly close sub-1.13 would leave Euro vulnerable to further losses with such a scenario targeting 61.8% retracement of the 2017 advance as well as the at 1.1186 backed by broader bullish invalidation at the slope confluence near 1.10.


Leave A Comment