See the times of year the EURUSD and Euro FX futures tend to do well and poorly, based on historical tendency.
A seasonal chart shows the tendencies of an asset to move higher or lower, or peak and bottom, at certain times of the year.
Instead of looking at the last 15 years of currency data in chronological order, what if you took each one year period, January to December, and printed it on a transparent slide. Then, put each year on top of each other. Doing this would highlight any period of the year which tend to be strong or weak. Luckily, we don’t need to do that. We can just take an average of the last 15 or 20 years to show what tends to occur at different times of the year.
Below we look at the pattern of Euro FX futures which will also aid in trading the EURUSD forex pair.
Euro Seasonal Patterns
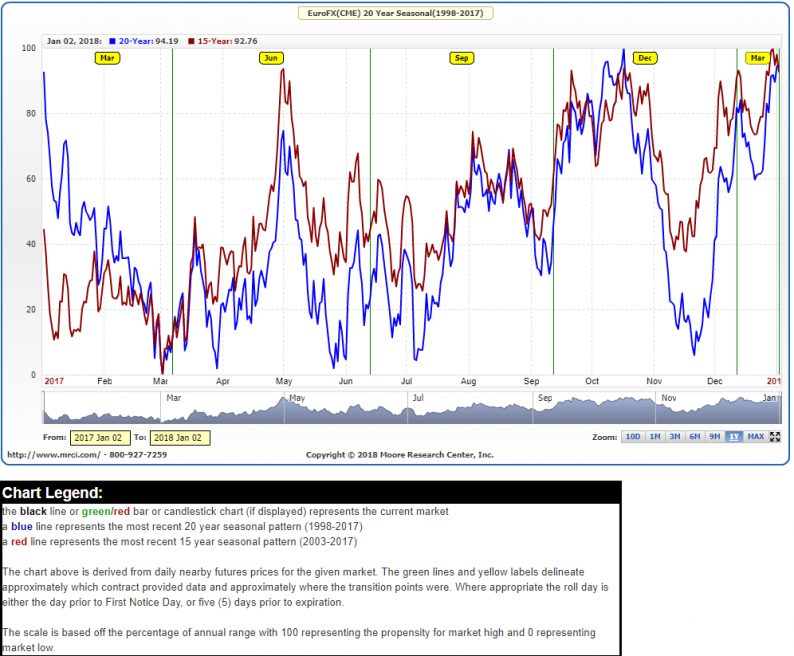
The Euro has seasonal tendencies, and we can see them by looking at the following seasonal chart of Euro futures, which are traded relative to the USD.
Euro Seasonal Chart- 15 and 20 Year

Source: MRCI.com
The chart shows the tendencies of the Euro over the last 15 and 20 years.
The chart below provides a more general guideline of which months tend to be good or poor for the EURUSD. As noted above, some pretty big moves start early, in the middle, or late in a month, so the prior chart is more detailed in that regard.


Leave A Comment