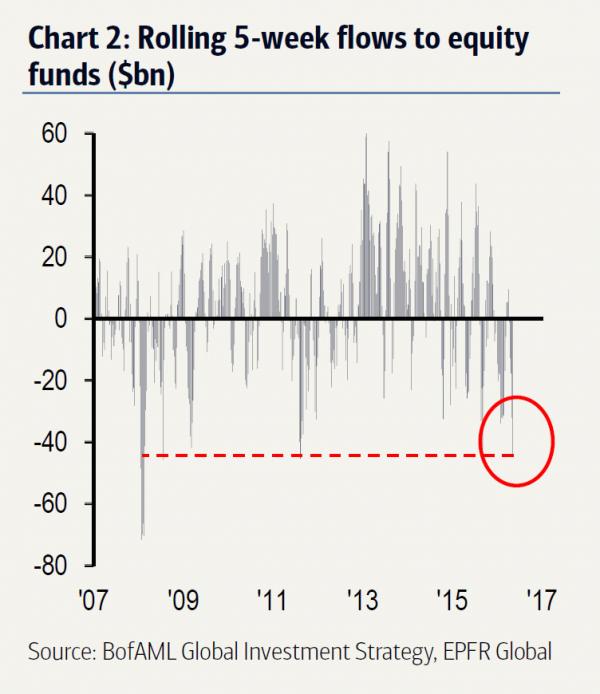
One recurring question over the past few weeks has been “who is buying” stocks in a world in which not only the smart money, but everyone else too is selling. The latest Lipper data will not provide the answer because as BofA reports, in the latest week there was another $7.4bn in outflows (the 5th straight week) driven by $4.8bn in mutual fund outflows and $2.7bn ETF outflows, leading to a $44bn equity exodus past 5 weeks, which as Michael Hartnett points out is the “largest redemption period since Aug’11”, or when the US downgrade sent US stocks into a bear market tailspin.

Digging into equity flows we find the following:
By sector, 12 straight weeks of REITs inflows ($0.8bn); 4 straight weeks of tech outflows ($0.2bn); first outflows from financials in 4 weeks ($0.4bn)
Some other fund flow findings:
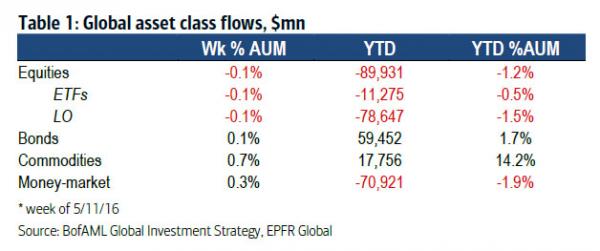
Michael Hartnett summarizes the longer term flow trends: bonds & gold over stocks, IG over HY, TIPS & munis over Treasuries; Big $2.3bn EM equity outflow (largest in 16 weeks); accelerating outflows from Europe; 4th consecutive week of redemptions from tech funds, 12th week of inflows to REITs; Risk-off $10.9bn inflows to money market fund.
Trend from active to passive continues apace ($1.2tn to equity ETFs, $0.9tn from mutual funds since 2007 – Chart 1)
BofAML private client allocations to bond & equity ETF’s up from 3% of AUM in 2009 to 9% today

In conclusion, here is Michael Hartnett’s take on markets whilch “look” better than they “feel”


Leave A Comment