This morning’s release of the February Existing-Home Sales increased from the previous month to a seasonally adjusted annual rate of 5.54 million units. The Investing.com consensus was for 5.41 million. The latest number represents a 3.0% increase from the previous month and a 1.1% increase year-over-year.
Here is an excerpt from today’s report from the National Association of Realtors.
Lawrence Yun, NAR chief economist, says sales were uneven across the country in February but did increase nicely overall. “A big jump in existing sales in the South and West last month helped the housing market recover from a two-month sales slump,” he said. “The very healthy U.S. economy and labor market are creating a sizeable interest in buying a home in early 2018. However, even as seasonal inventory gains helped boost sales last month, home prices – especially in the West – shot up considerably. Affordability continues to be a pressing issue because new and existing housing supply is still severely subpar.”
Added Yun, “The unseasonably cold weather to start the year muted pending sales in the Northeast and Midwest in January and ultimately led to their sales retreat last month. Looking ahead, several markets in the Northeast will likely see even more temporary disruptions from the large winter storms that have occurred in March.” [Full Report]
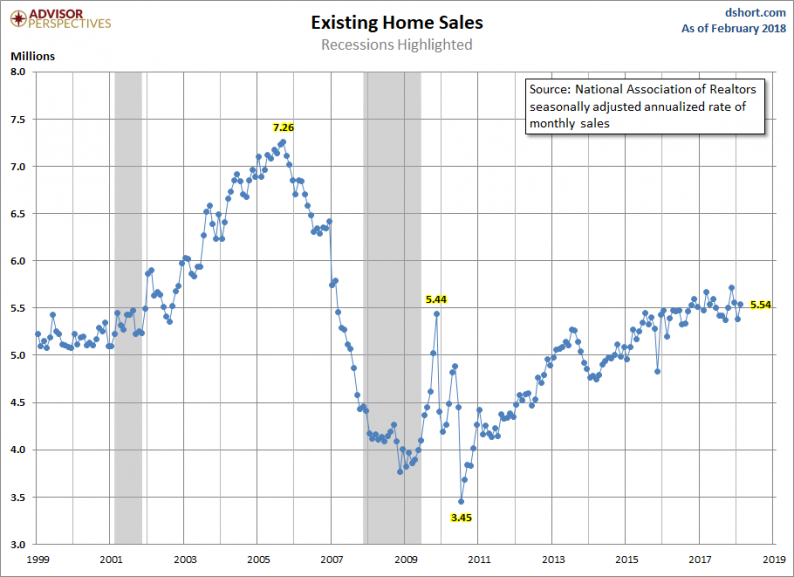
For a longer-term perspective, here is a snapshot of the data series, which comes from the National Association of Realtors. The data since January 1999 was previously available in the St. Louis Fed’s FRED repository and is now only available from January 2014. It can be found here.
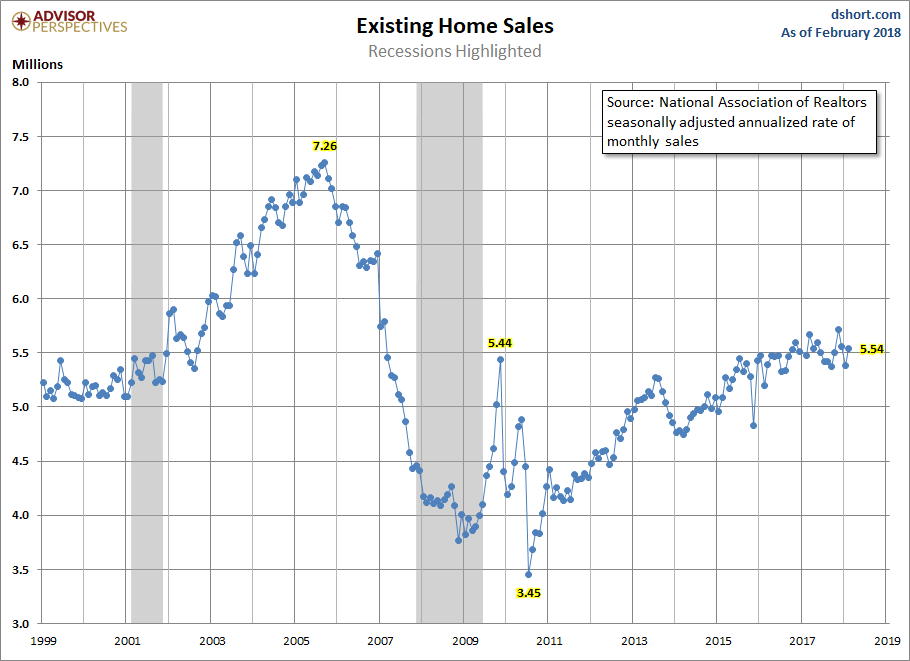
Over this time frame, we clearly see the Real Estate Bubble, which peaked in 2005 and then fell dramatically. Sales were volatile for the first year or so following the Great Recession.
The Population-Adjusted Reality
Now let’s examine the data with a simple population adjustment. The Census Bureau’s mid-month population estimates show a 17.8% increase in the US population since the turn of the century. The snapshot below is an overlay of the NAR’s annualized estimates with a population-adjusted version.


Leave A Comment