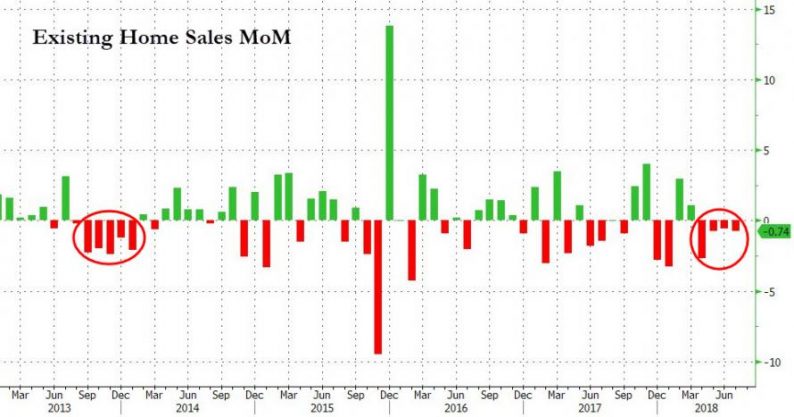
After June’s dismal US housing data, hope was high for a rebound in July but it was crushed as existing home sales tumbled 0.7% MoM (against expectations of a 0.4% jump). This is the longest streak of declines since the taper tantrum in 2013.

As lower-priced home sales collapsed…

This is the weakest SAAR existing home sales (5.34mm) since Feb 2016…

The median sales price increased 4.5% YoY to $269,600, but dipped MoM (seasonal norm)

Lawrence Yun, NAR chief economist, says the continuous solid gains in home prices have now steadily reduced demand.
“Led by a notable decrease in closings in the Northeast, existing home sales trailed off again last month, sliding to their slowest pace since February 2016 at 5.21 million,” he said.
“Too many would-be buyers are either being priced out, or are deciding to postpone their search until more homes in their price range come onto the market.”
“In addition to the steady climb in home prices over the past year, it’s evident that the quick run-up in mortgage rates earlier this spring has had somewhat of a cooling effect on home sales,” said Yun.
“This weakening in affordability has put the most pressure on would-be first-time buyers in recent months, who continue to represent only around a third of sales despite a very healthy economy and labor market.”
Total housing inventory at the end of July decreased 0.5 percent to 1.92 million existing homes available for sale (unchanged from a year ago). Unsold inventory is at a 4.3-month supply at the current sales pace (also unchanged from a year ago).


Leave A Comment