The economic calendar is light, the week is short, and the A-Teams are taking some time off. It is the formula for punditry gone wild. But what will be the subject, especially if Bitcoin is not moving much?
I suspect questions of two types. The first will focus on the tax cuts, identifying the winning and losing stocks and sectors. The second will update the list of worries for 2018.
It is a time for pondering, navel-gazing, pontificating and wondering:
Last Week Recap
In the last edition of WTWA speculated that passage of the tax cut might provide fresh lets for the rally. That was accurate for a couple of days.
The Story in One Chart
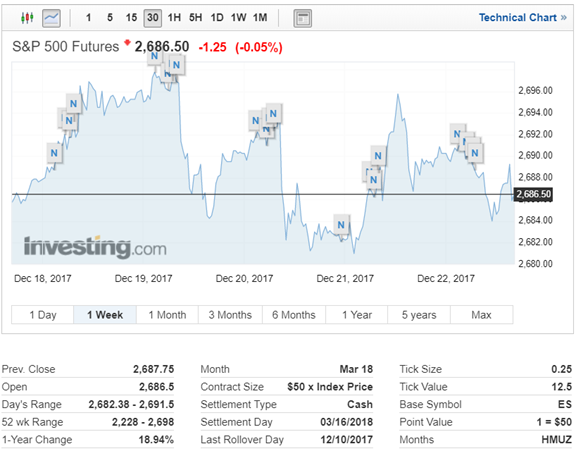
I always start my personal review of the week by looking at a great chart. In Chicago, if you ask a pro what the market is doing he probably says something like “SPU’s are up 6.” Futures trading on the S&P 500 is the fastest and most accurate way to summarize market action. Investing.com’s “Futures Overview” is an excellent interactive chart. If you hover over the “N’s” you will see the news callout at that point. Give it a try to see the quick reaction to various news events.

As usual, the weekly chart helps us see the moves, even though the overall volatility remained low.
Personal Note
This week I wrote a short and fun piece aimed at helping people sort out their reading sources. I hope you enjoy it, and find it helpful. You would be surprised at how often I chat with a new client about what they are doing and evaluate their current portfolios. Mike (my associate portfolio manager) and I can nearly always identify their favorite sources.

Noteworthy
Making a lot of money per employee is an interesting metric. See how well you can do in guessing the top companies.
The News
Each week I break down events into good and bad. For our purposes, “good” has two components. The news must be market friendly and better than expectations. I avoid using my personal preferences in evaluating news – and you should, too.
The economic news continues to be strong.
The Good
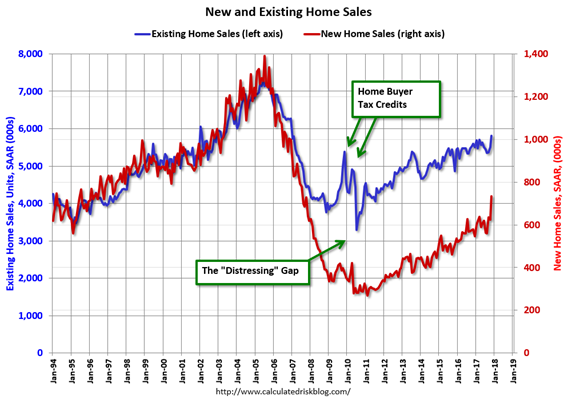
Following the housing bubble and bust, the “distressing gap” appeared mostly because of distressed sales. The gap has persisted even though distressed sales are down significantly, since new home builders focused on more expensive homes.
I expect existing home sales to move more sideways, and I expect this gap to slowly close, mostly from an increase in new home sales.
However, this assumes that the builders will offer some smaller, less expensive homes. If not, then the gap will persist.
The Bad
There was a little more bad news last week.


Leave A Comment