
The year-over-year rate of growth of the US Coincident Index marginally increased relative to last month’s revised level. A comparison of this US Coincident Index with the Aruoba-Diebold-Scotti business conditions index, Conference Board Coincident Index, ECRI’s Coincident Index, and the Chicago Fed National Activity Index follows.
Analyst Opinion of the Current Status of the Coincident Indicators
The reality is that most of the economic indicators have moderate to significant backward revision – but this month it seems the majority rear view mirror says the USA economy is slowing, flat or improving. Out of this group of coincident indicators discussed in this post, only ECRI and the Aruoba-Diebold-Scotti business conditions index have no backward revision – and both have a good track record of seeing the economy accurately in almost real time.
For February, it show that the economy is weak but not recessionary.
Economic indicators that coincide with economic movements are coincident indicators. Coincident indicators by definition do not provide a forward economic view. However, trends are valid until they are no longer valid, making the trend lines on the coincident indicators a forward forecasting tool.
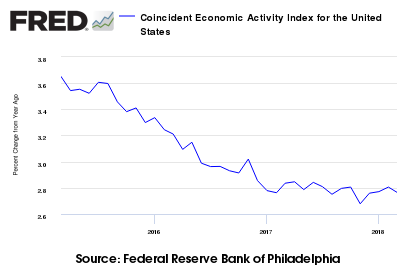
Excerpt from Philly Fed Report for the United States Coincident Index
The Federal Reserve Bank of Philadelphia has released the coincident indexes for the 50 states for February 2017. Over the past three months, the indexes increased in 47 states, decreased in two, and remained stable in one, for a three-month diffusion index of 90. In the past month, the indexes increased in 44 states, decreased in four, and remained stable in two, for a one-month diffusion index of 80. For comparison purposes, the Philadelphia Fed has also developed a similar coincident index for the entire United States. The Philadelphia Fed’s U.S. index rose 0.6 percent over the past three months and 0.3 percent in February.

z philly coincident.PNG


Leave A Comment