On a 12-month rolling total basis, federal deficit in August shot up to just under $900 billion. This at a time when the US economy is in expansion. In all probability, the red ink only gets worse from here. The question is, is this or not already reflected in 10-year T-notes?

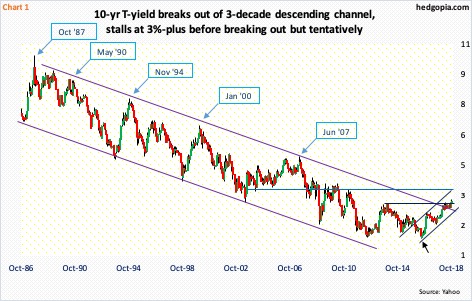
The 10-year Treasury rate (3.16 percent) has come a long way. As recently as September 2017, 10-year notes yielded 2.03 percent, and 2.81 percent on August 22 this year. Yields have come under slight pressure since reaching 3.25 percent eight sessions ago. Prior to this, early this month they broke out of the mid-May high of 3.12 percent. This resistance goes back to at least June 2003. Even before this, in April this year, the 10-year yield poked its head out of a three-decade descending channel.
Back in July 2016, the 10-year yield bottomed at 1.34 percent (arrow in Chart 1). Since then, it has made higher lows. A rising channel drawn thereof extends to 3.5-3.6 percent. There is also horizontal resistance at that level. In a perfect scenario for bond bears, yields may have room to test that level. How things evolve will depend a lot on what is in the price already. These notes have had their share of decline for over two years now. Fundamentally, one of the variables bond bears reliably cite for their negative bias is government deficit.
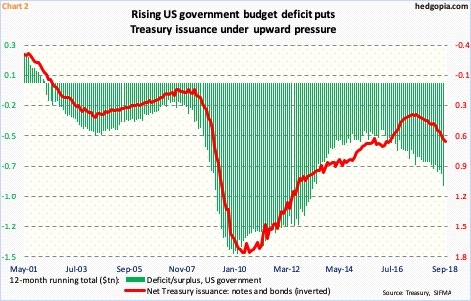
Great Recession ended in June 2009. The US economy has been in recovery/expansion mode since. That is nine-plus years. During all this, the federal government ran a budget deficit. In fact, on a 12-month rolling total basis the last time it had a surplus was in March 2002 (Chart 2).
More importantly, the budget trend is worsening. In January 2016, the deficit was $403.6 billion. This August, this had more than doubled, to $890.2 billion. Not surprisingly, issuance of Treasury notes and bonds has followed suit. In September, once again on a rolling 12-month basis, issuance was $602 billion, up from $335 billion from July 2017.


Leave A Comment