
The Federal Housing Finance Agency (FHFA) has released its U.S. House Price Index (HPI) for December. Here is the opening of the report:
?U.S. house prices rose 1.6 percent in the fourth quarter of 2017 according to the Federal Housing Finance Agency (FHFA) House Price Index (HPI). House prices rose 6.7 percent from the fourth quarter of 2016 to the fourth quarter of 2017. FHFA’s seasonally adjusted monthly index for December was up 0.3 percent from November.
“The fourth quarter showed absolutely no letup in the remarkable pace of home price appreciation through the country, “said Andrew Leventis, Deputy Chief Economist. “As we begin to track home prices in the first quarter, we will be interested to see whether new headwinds—higher mortgage rates and changes in tax laws—will lead to any moderation in the rate of price growth.”? [Read more]
The chart below illustrates the monthly HPI series, which is not adjusted for inflation, along with a real (inflation-adjusted) series using the Consumer Price Index: All Items Less Shelter.
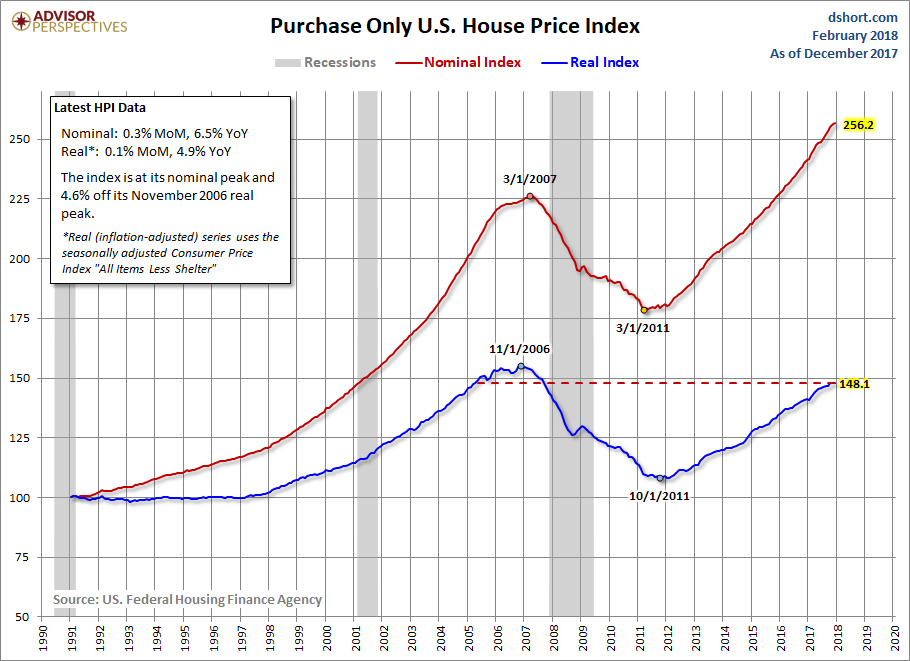
In the chart above we see that the nominal HPI index has exceeded its pre-recession peak of what’s generally regarded to have been a housing bubble. Adjusted for inflation, the index remains off its historic high.
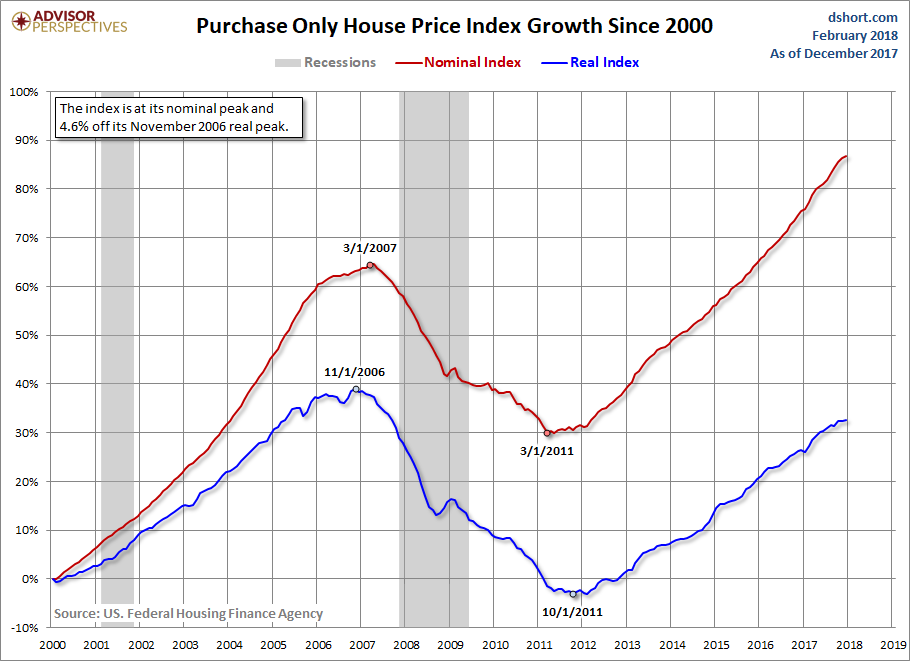
The next chart shows the growth of the nominal and real index since the turn of the century.
For an interesting comparison, let’s overlay the HPI and the most closely matching subcomponent of the Consumer Price Index, Owners’ Equivalent Rent of Residences (OER). Note: For an explanation of OER, see this PDF commentary from the Bureau of Labor Statistics.
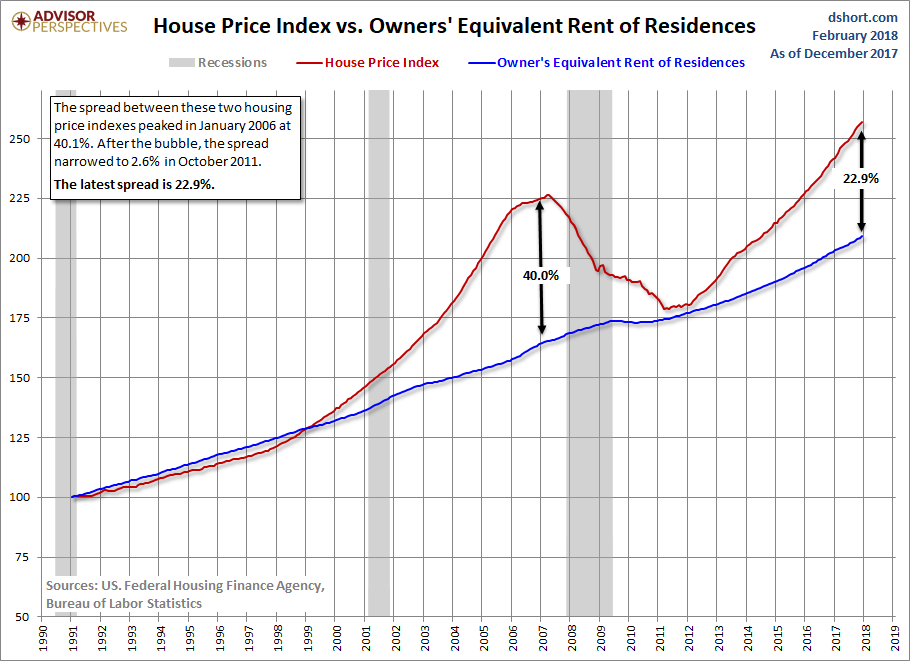
HPI and OER moved in close parallel from the 1991 inception date of the former until early 1999, when the two parted company and HPI began accelerating into the housing bubble. HPI then fell 20.7% over the next 48 months to its March 2007 trough. Confirmation of the “bubble” designation for house prices is the 40.1% spread between HPI and OER in January 2006.


Leave A Comment