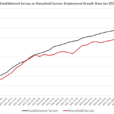
As I have noted before, I highly recommend that you econo-geeks put a bookmark on FloatingPath.com, because Nick puts pictures to the raw economic data usually delivering the day’s relevant economic releases in visual form at about 4:02 US Eastern just after the market close.
I for one am a visual learner*, and not so much a facts and figures learner. His post-Payrolls set is something I depend on each month and often include them in NFTRH. The set bores into the details of what was and was not relevant in the Payrolls report.
Today’s mail was not based on an economic data release. Today it is just several charts he found “cherry picked” around the internet, with outdated data in support of already preconceived viewpoints. Anyway, FloatingPath fixes them…
This is not a complete picture of the economy, but I’ve updated these cherry-picked charts and set each axis to start from 1960.”

I think he is kind of a perfectionist, which is my kind of guy.
* Pictures are vital to my learning style, which is also heavily rooted in psychology. I don’t really go into it, but aside from being supremely interested in market sentiment and psychology, I keep a psych profile (either simple or detailed) in the form of mental notes on some of the people I’ve interacted with, especially the few crazy, scary, compulsive and/or intellectually dishonest types I’ve come in contact with out here on the internet. Okay, economic data to psychological profiling… sounds about right!


Leave A Comment