The big economic number next week will be the Q3 Advance Estimate for GDP on Wednesday the 28th at 8:30 AM ET. With the volatile first two quarters behind us with their real annualized rates of 0.6% in Q1 and 3.9% in Q2, what do economists see in their collective crystal ball for Q3 of 2015? Let’s take a look at the latest GDP forecasts from the latest Wall Street Journal survey of economists conducted earlier this month.
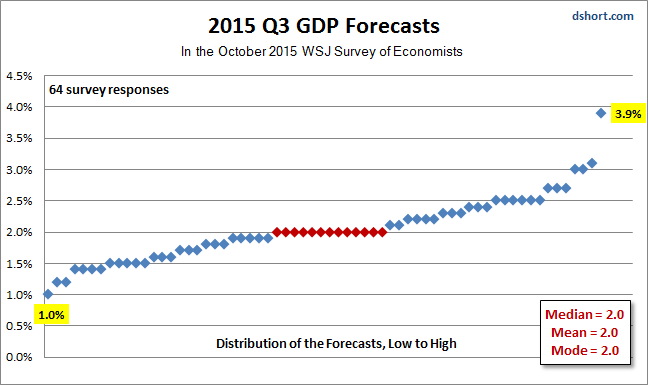
Here’s a snapshot of the full array of WSJ opinions about Q3 GDP with highlighted values for the median (middle), mean (average) and mode (most frequent). In the latest forecast, interestingly enough, all three are identical at 2.0% forecast by 13 of the 63 respondents — that’s twenty percent of them.

GDP in 2015
Next week’s release of the Advance Estimate for Q3 GDP is, of course, a rear-view mirror look at the economy. The WSJ survey also asks the participants to forecast year-end annual GDP 2015. Here is a snapshot of that forecast range along with the latest Federal Reserve GDP projections.
Also of interest is the Atlanta Feds’ GDPNow™ forecasting model, which currently puts Q3 GDP at 0.9% as of October 20th.

As for the WSJ forecasts for 2015 annual GDP, here is the latest.

Q1 was a temporary contraction; that is certainly the view of the WSJ survey participants. Even the most pessimistic of the lot sees 1.8% for the 2015 year-end print, and the median and mean are forecasting 2.4%, the same as the 2014 rate.
GDP: A Long-Term Historical Context
For a broad historical context for the latest forecasts, here a snapshot of GDP since Uncle Sam began tracking the data quarterly in 1947.

A More Intuitive Look at Quarterly GDP
Let’s take one more look at quarterly GDP — the year-over-year percent change, which is certainly more intuitive than the conventional practice of the Bureau of Economic Analysis of calculating GDP bycompounding the quarterly percent change at annual rates (which they explain here). Consider: the four quarters of 2014 GDP using the BEA’s preferred method are -0.9%, 4.6%, 4.3% and 2.1%. The year-over-year change in the three quarters is a much less attention-grabbing 1.7%, 2.6%, 2.9% and 2.5%. However, when we use the more intuitive percent change from a year ago, we get a long-term perspective on where we are in the grand scheme of things, one the more closely resembles the regression in the chart above.

Related Posts
 This Rare Signal Just Triggered, And It’s Not Good
 Argo Blockchain is at risk of closing if it fails further financing
 “No Brainer” Apple Extends Losses Despite Analyst Pleas That Guidance “Better Than Feared”
 WTI Crude Oil And Natural Gas Forecast – Friday, August 31
 Dollar, Gold, Odds Of Recession? Numerous Things More Important Than Midterms
 S&P 500 And Nasdaq 100 Forecast – Wednesday, August 23


Leave A Comment