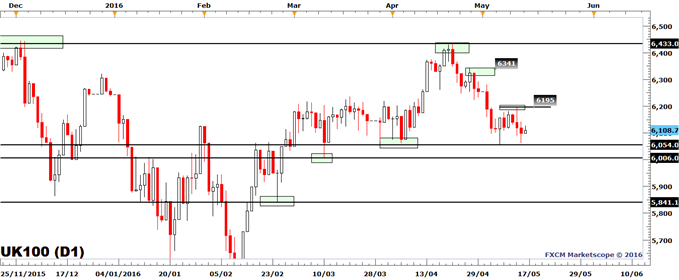
The FTSE 100 (CFD: UK100) had risen slightly from Friday evening’s levels as trading resumed following the weekend. However, looking beyond today’s higher prices, the FTSE 100 remained trapped in 6054 to 6195 range. The 6054 level is the May 6 low, while the May 12 high is the 6195 level.
As price is trading sideways, neither bullish nor bearish traders have strong control over price and it is common for price to keep on trading sideways and for the range to narrow further until a break to the range occurs. While this may be uninspiring for trend traders, however, when price finally does breach its range, it may be the start of a new trend.
For the current stalemate to end, a breach to the 6054-6195 range may be required. Support levels below the May 6 low of 6054 are the March 10 low of 6006, followed by the February 24 low of 5841. The steep decline from the May 6 low of 6054 to the February 24 low of 5841 is due to the bullish trend since February potentially ending on a breach to the May 6 low of 6054. The bullish sequence of higher lows since February sits at 5841, 6006, and 6054.
Resistance levels above the May 12 high of 6195 are the May 3 high of 6283 and the March 27 high of 6341.
FTSE 100 | CFD: UK100

Created with Marketscope/Trading Station II; prepared by Alejandro Zambrano
There are no market moving events from the U.K. in today’s session. On Saturday, Chinese Industrial Production rose by 6% YoY vs. the 6.5% expected and remained lower than the 6.8% prior. Retail Sales rose by 10.1% YoY, lower than the 10.5% in March and lower than the 10.6% rise projected as per a Bloomberg News survey. In both instances the lower than expected readings suggest that the Chinese economy is not doing as well as economists projected, something that could dampen the mood of FTSE 100 traders, especially given the large amount of commodity related firms in the index.


Leave A Comment