
The FTSE 100 (as other global stock markets) is correcting some of last week’s losses and is expected to be volatile given the bearish market trend. The index (FXCM: UK100) is up by 1% at the time of writing.
Short-term Valuation: Oversold
Our short-term valuation model based on the last six months of the Bloomberg commodity index suggests the FTSE 100 should be 1.7% higher (5950), while using the DAX as the explanatory variable suggests that the FTSE 100 should be trading 2% higher (5970). This discount may fully correct, but it’s not my main scenario, rather I see a partial correction as the FTSE 100 only reaches the 5870 to 5900 range. Traders will in this range be tempted to short, given that the overall trend is bearish below last week’s high of 6016. The next level of support and profit target for bearish traders is most likely the psychological level of 5700. Near this level we also find the S1 (support 1) of the weekly Pivot point indicator.
The developments across commodities complex, the soft manufacturing sector of the U.S. and the volatile Chinese Yuan and stock market are expected to keep weighing on the FTSE 100.
FTSE 100 | FXCM: UK 100 | 1 Hour Time Frame
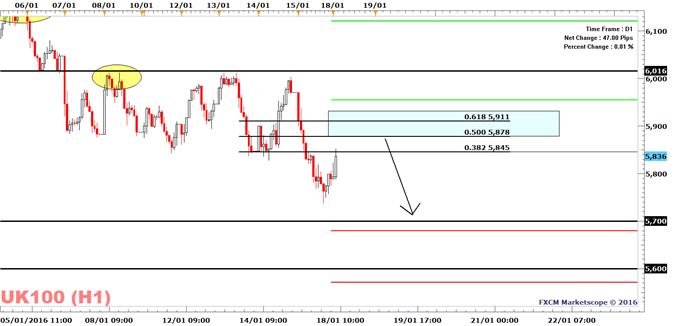
Created with Marketscope/Trading Station II; prepared by Alejandro Zambrano
Longer-Term Outlook: We May Reach The November 2012 Low of 5596.5
The FTSE 100 breached some significant levels last week. Firstly, on the weekly-time-frame it closed well below the support of September and December at 5869. Secondly, it traded below its August low of 5789, which opens the door for a decline to the November 2012 low of 5596.5. This level is also pointed out as support (and profit target for bearish traders) by the monthly Pivot point indicator. The weekly chart will be bearish as long as we trade below the December 29 (this level may change if a new lower high is created in the weeks ahead).
FTSE 100 | FXCM: UK 100 | Weekly Time Frame


Leave A Comment