
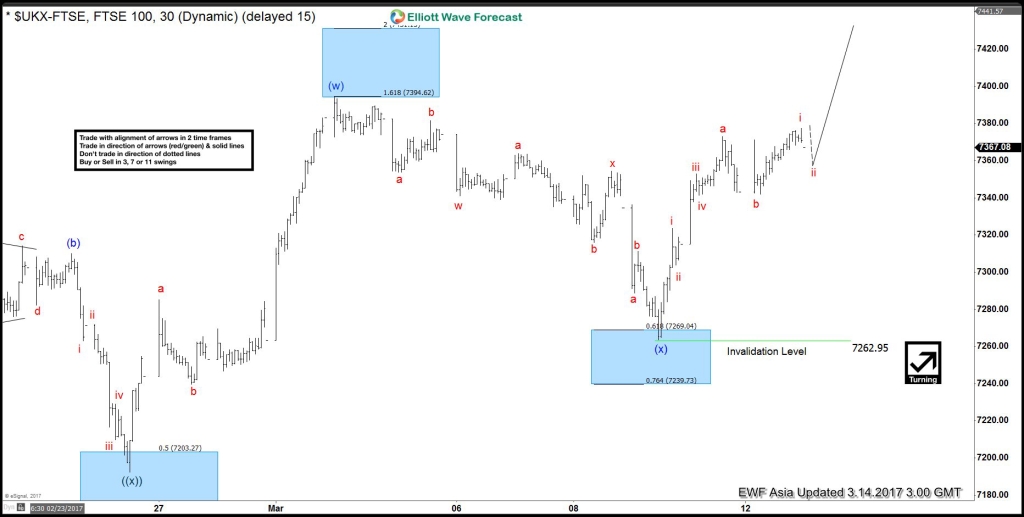
Short term Elliott wave view in FTSE suggests that the instrument is showing a 5 swing sequence from 2/1 low (7087.67) favoring more upside. From 2/1 low, the Index is rallying as a double three Elliott wave structure where Minute wave ((w)) ended at 7329.56 and Minute wave ((x)) ended at 7192.45.
The Index has since broken above 7329.56, suggesting that the next leg higher in Minute wave ((y)) has started. The sub-division of Minute wave ((y)) is also in a double three Elliott wave structure where Minute wave (w) ended at 7394.6 and Minute wave (x) ended at 7262.95.
Up from there, a rally is unfolding as a zigzag Elliott wave structure where Sub minute wave a ended at 7373 and Sub minute wave b ended at 7342.02. Near term, while pullbacks stay above 7262.95, and more importantly above 7192.45, expect the Index to extend higher. We don’t like selling the Index.
FTSE 1 Hour Chart 03.14.2017


Leave A Comment