
Last week, GBP/USD ended the cycle from 02/02/2017 peak which unfolded as a double three Elliott wave structure with a FLAT in the Y leg. Pair slightly exceeded 123.6 Fibonacci extensions (1.2145) of the first 3 swings lower from 2/2 peak before making a push higher today. With the bounce seen today, it has become clearer that pair has ended the cycle at least from 2/24 (1.2570) high at least and as dips hold above 1.2132 low, the pair can extend into the bounce. In the near-term, the pair ended 3 waves bounce and it’s expected to pullback lower against the recent low 1.2132. The pair should hold above that level for 1 more leg higher at least and could reach as highs as 50 – 61.8 Fibonacci retracement area that comes around 1.2420 – 1.2486 area.
If GBP USD makes another low, it should still be in the same cycle from 2/2 (1.2706) and decline could then be labelled as an ABC from 02/02 peak and the new low will be part of wave (( v )) of C New low, if seen, should be short-lived and we can see the pair bouncing again from 1.2100 – 1.2009 area.
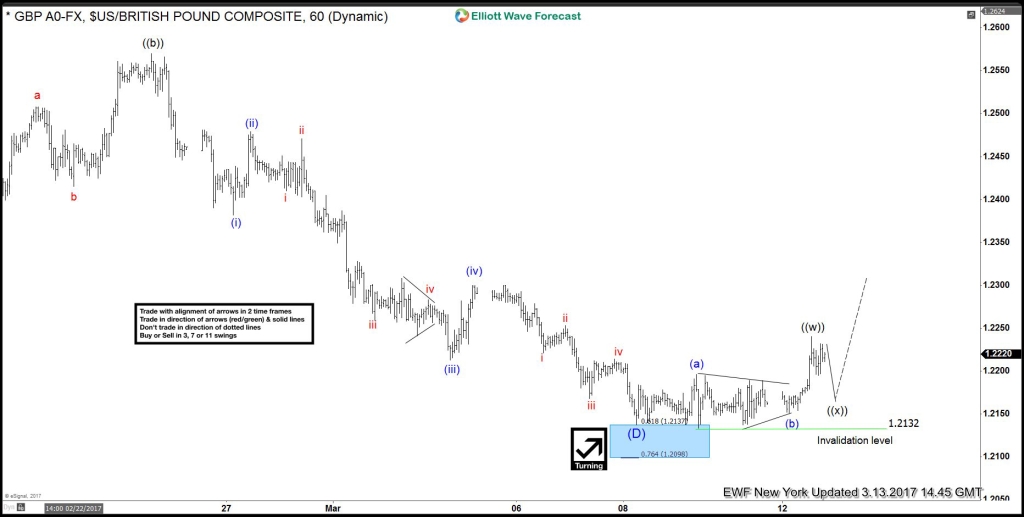
GBP USD 1 Hour Chart 03.13.2017


Leave A Comment