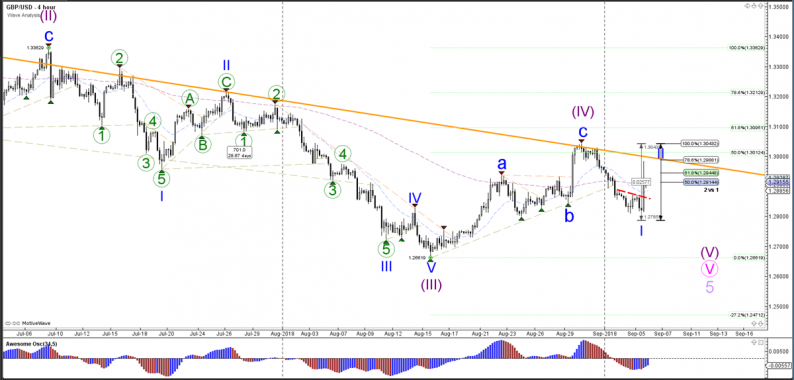
GBP/USD
4 hour
Source: Admiral Markets MT5 with MT5 GBP/USD motive wave – 6 September 2018 at 5:00 AM GMT
The GBP/USD showed a strong bullish spike yesterday, which could indicate a completed bearish wave 1 (blue) and a pullback within wave 2 (blue). This is invalidated if the price manages to break above the previous top, together with, the 100% Fibonacci retracement level around 1.3040. A break below the support trend line (blue) confirms the bearish breakout.
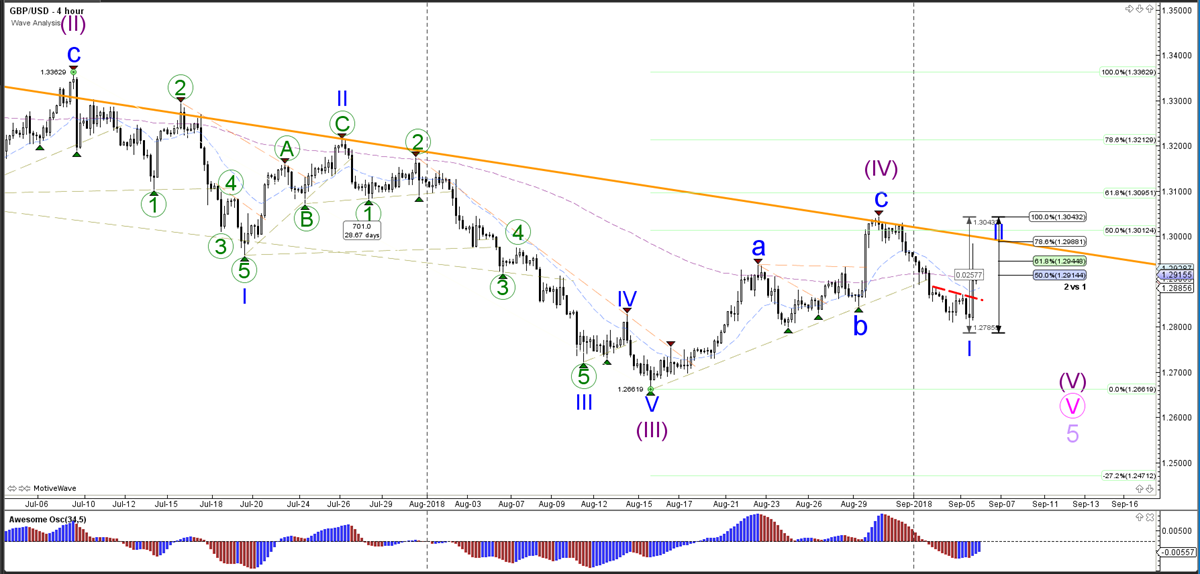
1 hour

Source: Admiral Markets MT5 with MT5 GBP/USD motive wave – 6 September 2018 at 5:00 AM GMT
The GBP/USD broke the triangle to the downside and completed a wave 5 (green) before moving up quickly. The spike could either be a pullback within the downtrend or a reversal, which will depend on the next breakout direction. The GBP/USD hit the 78.6% Fibonacci retracement level, which acted as a resistance spot. The price will need to break below the support (blue zone) and then show a bear flag pattern, before a downtrend continuation has better odds of success.


Leave A Comment