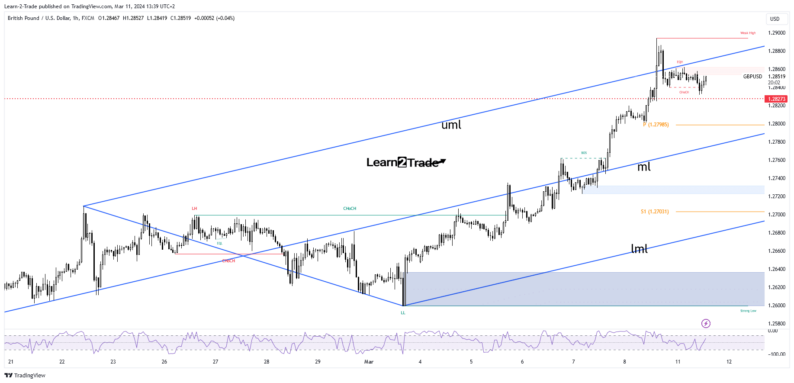
The GBP/USD price turned to the downside after reaching a high of 1.2893 on Friday. The pair is trading at 1.2820 at the time of writing. The pair is correcting gains after a massive bull run.Fundamentally, the US reported mixed data in the last trading session. The NFP came in at 275K in February, versus 198K expected and above 229K in the last reporting period. However, the unemployment rate jumped from 3.7% to 3.9%, while average hourly earnings rose by 0.1%, less than the estimated growth of 0.2%.Today, the technicals could move the price. Meanwhile, the fundamentals should bring high action again tomorrow.The United Kingdom claimant count change is expected at 20.3K, above 14.1K in the previous reporting period. The unemployment rate should remain at 3.8%, while the average hourly earnings indicator may announce a growth of 5.7%.Still, the US inflation data publication represents the most important event of the current week. The CPI m/m may announce a 0.4% growth in February versus a 0.3% growth in January. CPI y/y could remain at 3.1%, while Core CPI may report a 0.3% growth. Higher inflation could boost the greenback. GBP/USD Price Technical Analysis: Support at 1.2800  GBP/USD 1-hour chartTechnically, the GBP/USD price jumped above the ascending pitchfork’s upper median line (uml) but failed to stay above this dynamic resistance, signaling exhausted buyers.The pair tried to retest this upside obstacle, and now it could approach the 1.2800 former resistance that turned into support.The weekly pivot point of 1.2780 is also seen as a potential downside target. Failing to take out the upper median line (uml) may result in a correction towards the median line (ml), which is a critical downside obstacle. The bias remains bullish as long as it stays above it.More By This Author:USD/CAD Outlook: Markets Assess Canada’s Upbeat Jobs ReportEUR/USD Outlook: Dollar Declines As US Jobs Data LoomsUSD/CAD Forecast: BoC Deals A Blow to Rate Cut Expectations


Leave A Comment