
The GBP/USD fell on US Dollar strength but stabilized as the greenback took a breather. What’s next?
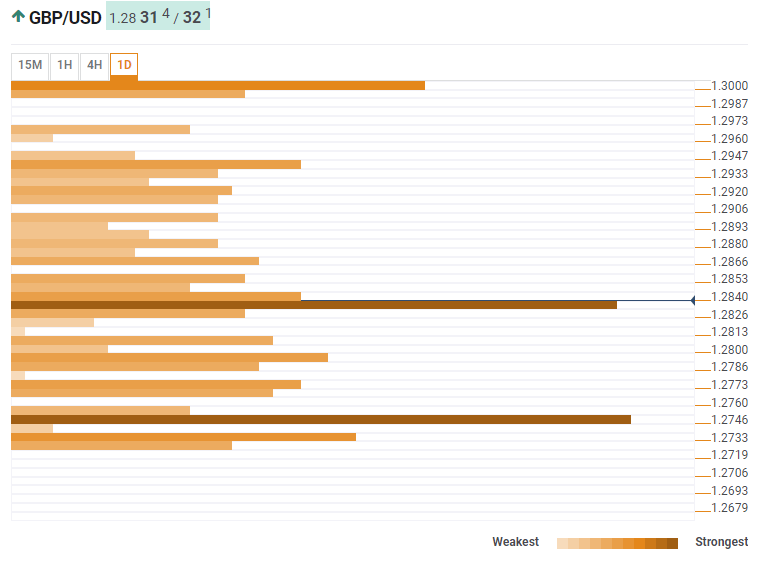
The Technical Confluences Indicator shows that the pair has significant support at 1.2830 which is a dense cluster of potent technical levels including the Simple Moving Average 10-15m, last week’s high, the SM 5-4h, the SMA 5-15m, and the Fibonacci 23.6% one-day.
A break will open the door to 1.2746 which is the convergence of the Pivot Point one-month Support 2, the PP one-day Support 2, and the Fibonacci 61.8%.
Looking up, there are many lines of resistance with the most prominent one only at 1.2947 which is the PP one-month Support 1 and the Bolinger Band 4h-Upper.
The round number of 1.3000 is already stronger resistance with the SMA 200-4h, the PP one-week Resistance 3, and the Fibonacci 161.8% one-day.
This is how it looks on the tool:
Confluence Detector
The Confluence Detector finds exciting opportunities using Technical Confluences. The TC is a tool to locate and point out those price levels where there is a congestion of indicators, moving averages, Fibonacci levels, Pivot Points, etc. Knowing where these congestion points are located is very useful for the trader, and can be used as a basis for different strategies.
This tool assigns a certain amount of “weight” to each indicator, and this “weight” can influence adjacents price levels. This means that one price level without any indicator or moving average but under the influence of two “strongly weighted” levels accumulate more resistance than their neighbors. In these cases, the tool signals resistance in apparently empty areas.


Leave A Comment