
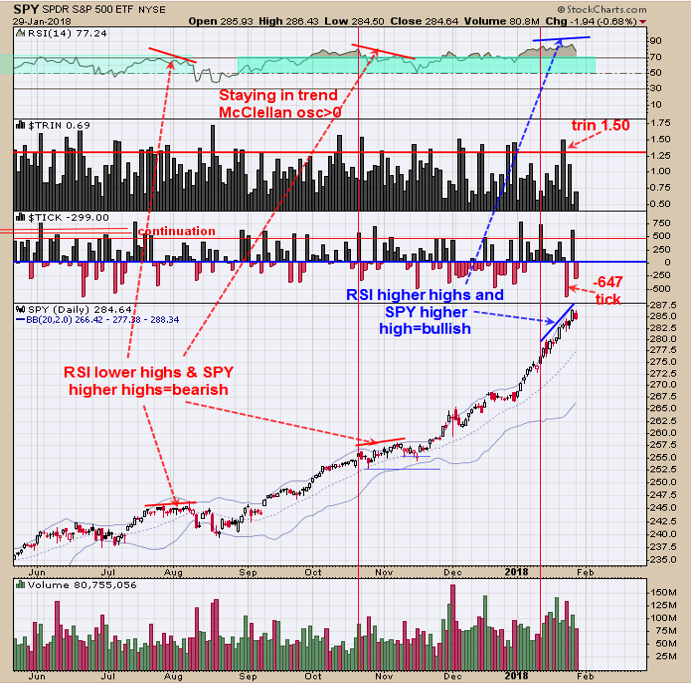
Momentum weakens first before it goes high in the market. In August and November 2017, there were minor highs, the RSI started making lower highs as SPY made minor new highs before a pullback started. The situation going on now shows the RSI is still making higher highs as the SPX is making higher highs and showing no divergence. This suggests that the uptrend may continue. Last Tuesday the TRIN closed at 1.50 and last Wednesday the Tick closed at -647, that is really a bullish combination for the short-term.
With new energy from the bullish TRIN and Ticks readings, the rally is expected to continue. The FOMC meeting on Wednesday could have an effect on the market. Long on 1/23/18 & 2839.13.
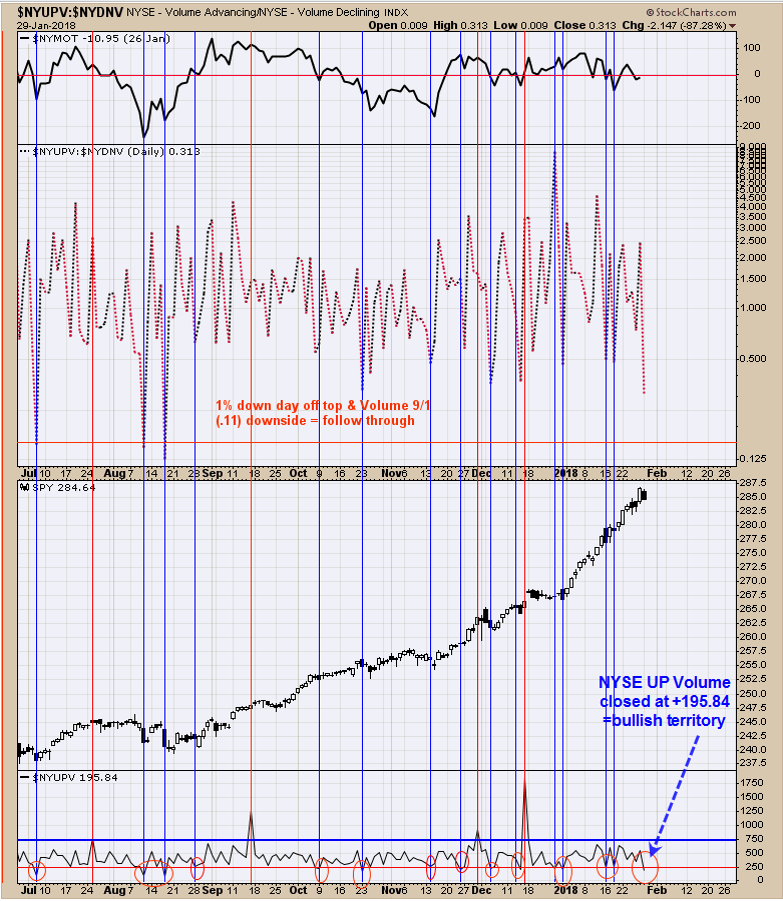
There is still one bullish study in play, when January is up 11 of the last 14 days the next 9 days are up 93% of the time. The bottom window on the chart above is the NYSE Up Volume. Tops have formed when the NYSE UP Volume reached above +750 with a recorded short-term bottoms that have formed with less than +250. Today’s reading came in at +195.84 and it is in the bullish level. This Wednesday is the FOMC meeting announcement, which can have an effect on the markets. If the market becomes “exuberate” in and around 1/31 than that could lead to a short-term top. A way to measure “exuberate” is for the NYSE UP Volume to reach above +750. Long on 1/23/18 & 2839.13.

The chart above is the Weekly GDX which broke above its October 2017 high. However, on the weekly GDX/GLD charts, the Advance/Decline and the Up-Down Volume indicators did not show a weekly divergence.
The weekly Divergence on GDX suggests that the rally which started in December may stall. You should also notice that the weekly Bollinger bands are all “Pinching” on the indexes above, suggesting that a large move is coming. We don’t have it shown here on the charts but the retracement from the late 2015 lows, retraced between 38.2% and 50% suggests that the large move break will be to the upside.There is a large move coming up that may break up (according to Fibonacci), but first, a pullback is possible that may last several weeks.


Leave A Comment