

Another week of volatility, but with no real resolution to the burning question of “where do we go next?”
Is this a continuation of the broadening topping process that began 15 months ago? Or, are the markets setting up the next bullish advance to all-time highs?
Unfortunately, while we can all speculate, the reality is that we will not know for certain until a decision has been made. As such, this is why I have kept long-term investment models conservatively allocated up to this point and still maintain a 50%+ exposure to cash.
The reasoning is simple. If the markets re-establish the bullish trend, I can rotate from the safety of “cash” back into equity-based risk. However, and unfortunately for those individuals that continually tout “buy and hold” investing, if the market breaks to the downside the next bull market rally will be primarily used making up previous losses.
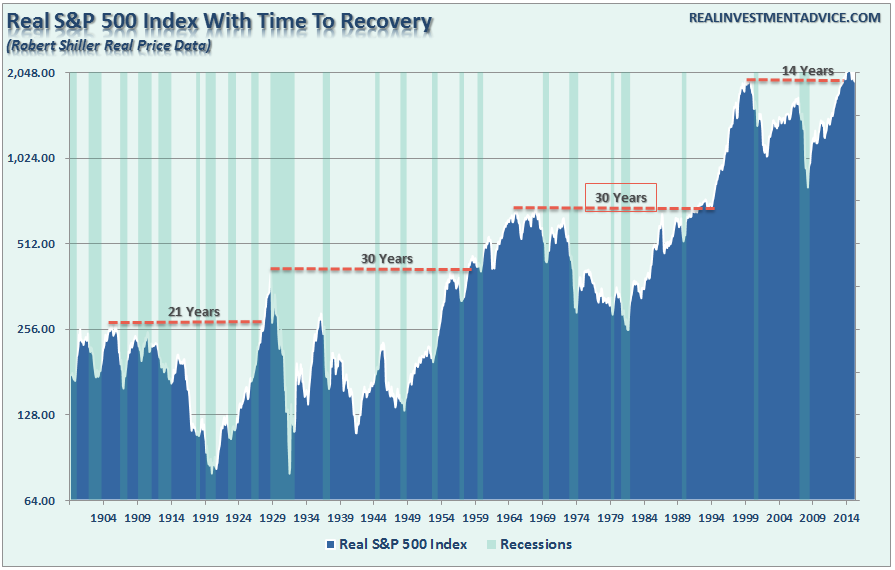
This is an important concept to understand. Historically speaking, when markets have a combination of high valuations and declining earnings, outcomes have been less than favorable. Yes, eventually the markets, and subsequently investors, did get “back to even.” However, as shown in the chart below, the markets make new highs roughly about 5% of the time. The other 95% of the time the markets are making up previous losses.
“Getting back to even is not a long-term investment strategy.”
While I am not predicting the market is about plunge tomorrow, what I am suggesting is that the current market setup is much akin to previous major market topping processes as opposed to the beginning of new long-term secular bull market.
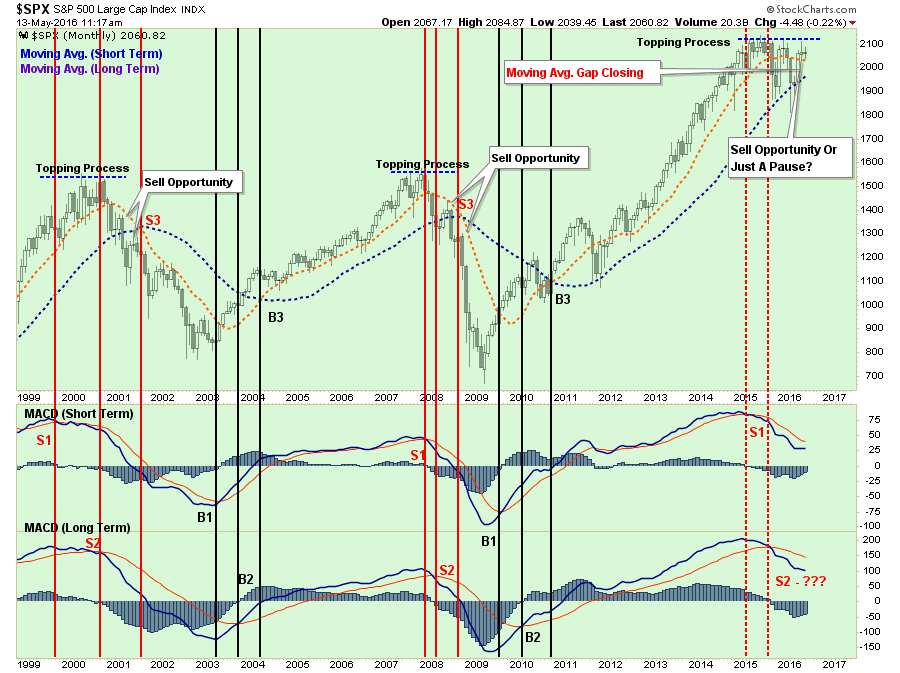
The chart above shows three long-term (monthly) buy/sell indications. Currently, two of the three long-term sell signals are in place. The third signal, which is a crossover of the intermediate and long-term moving averages, has not occurred as of yet, but the gap is closing.
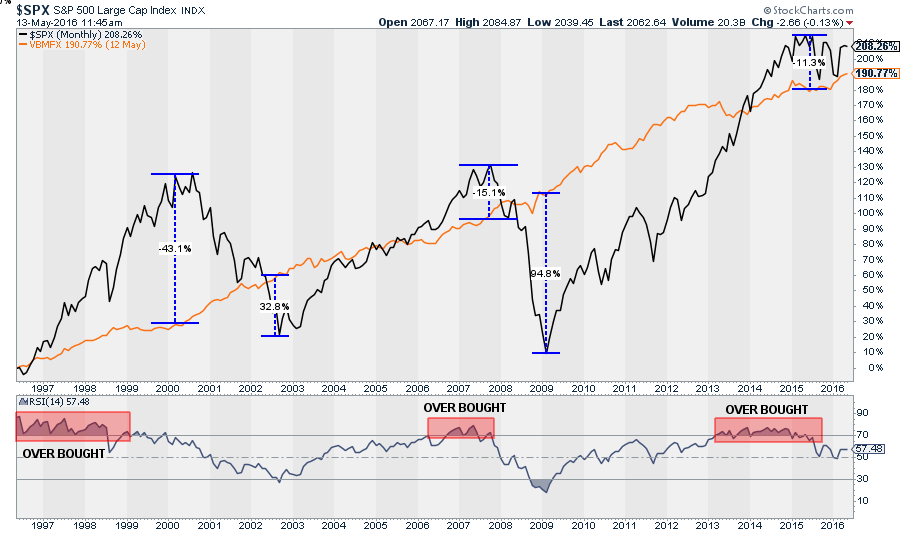
One other point of concern. As shown in below, equities are once again extended well above bonds. Not surprisingly, the risk of reversion lies with the equity side of the ledger. Furthermore, highlighted in red, the markets are currently in the process of working off their extreme overbought condition which has tended not to be kind to longer-term investors either.
Got It…But What About Now?
But that is soooo long-term.
I know…boring. More importantly, as Howard Marks once quipped:
“Being right, but early, is the same as being wrong.”
While the long-term picture still clearly suggests a high level of risk aversion, short-term dynamics have improved which led to a small increase in equity exposure several weeks ago. As shown below, the market has continued to defend the 50-day moving average of the last week while in a corrective process, until Friday.
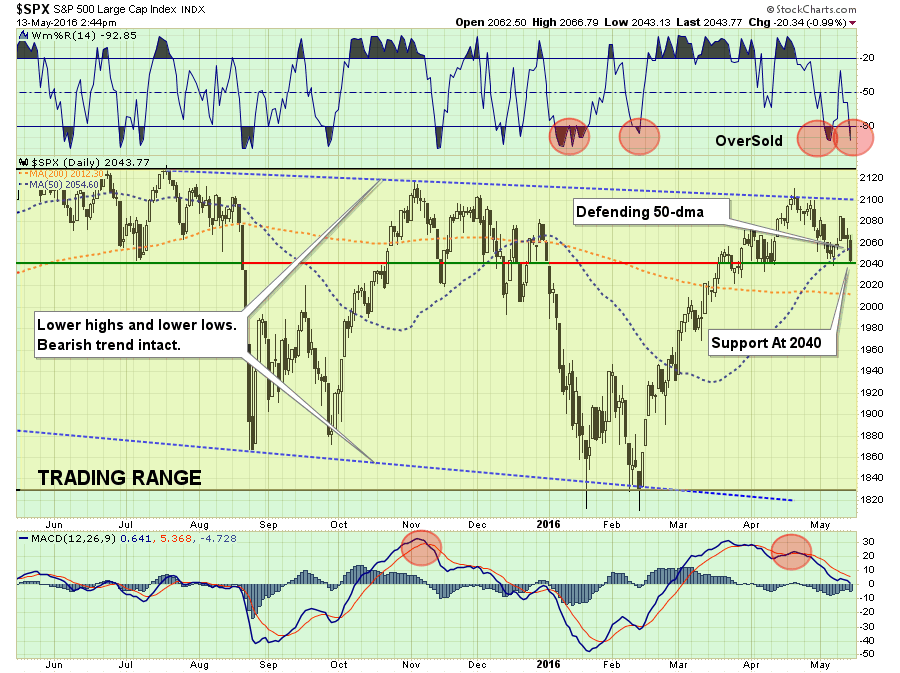
While the market did violate the 50-dma on Friday, the market held support at recent bottoms. Critically, there is a“head and shoulders” process being formed and the 2040 level is the neckline support of that pattern. A break of that neckline will lead to a more substantial correction process.
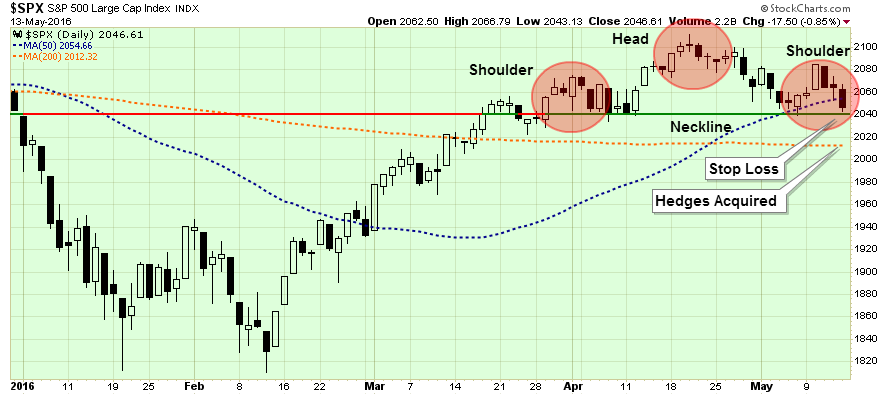
With the 50-dma trending positively above the 200-dma, we do want to give the markets the benefit of the doubt currently, but I am not dismissing my sense of caution. This is also particularly the case given the recent strength in the advance-decline line and overall breadth of the rally.
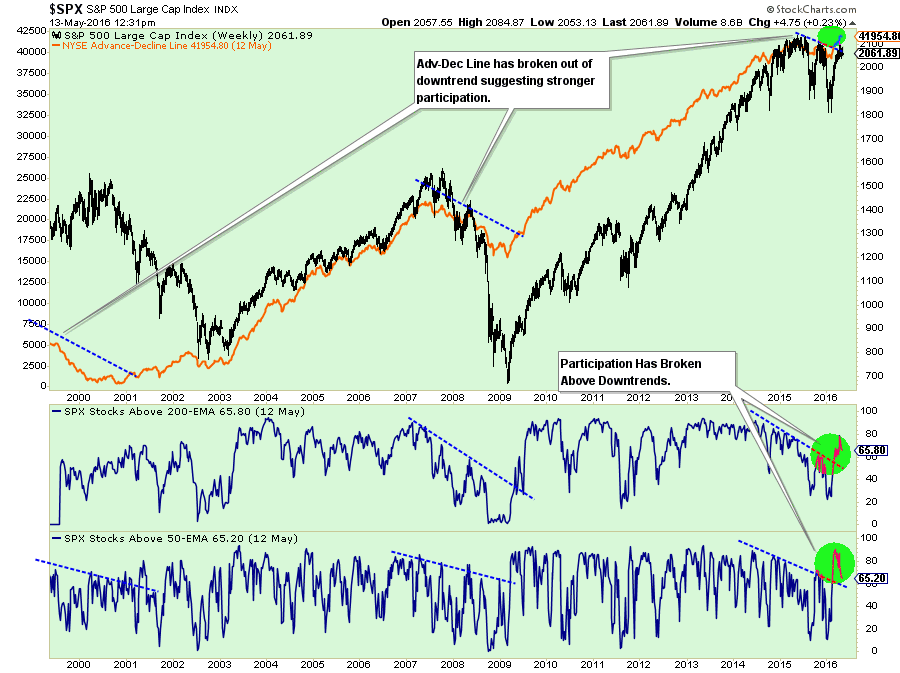
However, the breakout of the advance-decline line to new highs, may not be “all that.” As noted by Dana Lyons this past week.
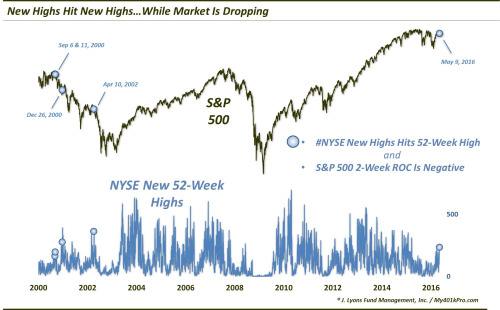
“Believe it or not, however, that’s not the strangest development, in our view. On Monday, May 9, NYSE New Highs recorded another 52-week high. What was unusual about it was that the stock averages were in the midst of a multi-week selloff. In fact, of the 116 days since 1970 that the NYSE New Highs hit a 52-week high, this marked just the 4th time the NYSE was showing a negative 9-day rate of change – and a record worst -2.20% at that.
As far as the S&P 500 is concerned, it was just the 5th time the index had a negative 2-week rate of change on those days, as shown here.”
“As the chart above shows, the previous 4 occurrences regarding the S&P 500 all took place during the 2000-2002 bear market. Needless to say, stock performance following these events was atrocious.”
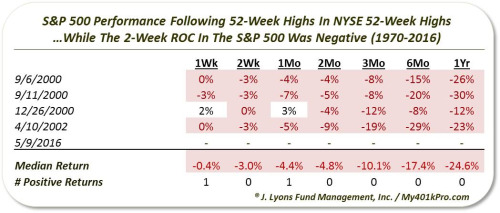
“Therefore, our most valuable takeaway is simply the fact that what seemed like a development with bullish ramifications, is not necessarily so when looking at prior precedents.”
Hmm…This Looks Familiar
One other thing. While the short-dynamics “LOOK” bullish, it potentially may not be so as Dana pointed above.Furthermore, the technical setup is also playing out very similarly to that in November of last year as shown below.


Leave A Comment