
I often include charts in my weekly missives for a number of reasons, but the truth of the matter is that they add a little color to what would normally be a pretty drab bombardment of opinion delivered via text. By adding charts, it creates the illusion that I actually understand technical analysis (which I don’t other than what I gleaned during a two week training program in 1977 while in the employ of McLeod Young and Weir) and that it is useful in the forecasting of price trends in gold and silver over the long term. Well, I have a secret to tell you—”T.A.” (as it is called by the “in crowd”) is USELESS. “Cup and handles,” “hanging Chinamen, “engulfing knickers,” “tombstone dojis”—you can fire them all in the waste bin because that is precisely where they belong.
I was reading a certain metals report last night where, sure enough, the author missed the top by a country mile, albeit he admitted it and apologized to his subscribers (which was truly admirable). I found it interesting that in order for him to get a “clue” to the next move in gold, he would have to “turn to the charts.” So what I will do now is turn to MY charts and demonstrate in no uncertain terms why charts are CREATED by the bullion bank traders in order to trap the “chartists” (and their subscribers) into false senses of security.
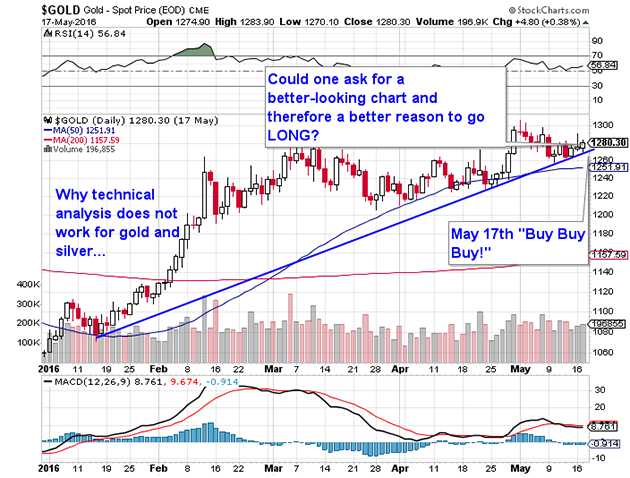
Above is a wonderfully bullish TEXTBOOK chart of gold from May 17, when the author of this newsletter told everyone to look for a big up move. . .
The next chart provided below was what actually happened to the gold market AFTER the 17th and everyone points to Janet Yellen’s hawkish call from the FOMC minutes and ensuing rally in the USD, but the reality was that it really wasn’t “event-driven” (by the Fed). It was “profit-driven” by a group of colluding criminals who fed carload after carload of synthetic gold by way of the Comex into the market in the $1,280—$1,300 range, which absorbed all of the upward price pressure exerted by Large and Small Speculators as open interest exploded to all-time highs. Notice how they kept the price movement perfectly aligned to the rising uptrend line during the last week of the advance during which the chart pattern evoked a gargantuan response from the chart-watchers seen by the explosion in open interest to nearly 600,000 contracts. That was the perfect technical “set-up” to the heist.


Leave A Comment