
Technical Backdrop
If only we could get a dime for every bearish article on gold that has been published over the past two weeks…but one can’t have everything. When a market is down 83% like the HUI gold mining index is, we are generally more interested in trying to find out when it might turn around, since it is a good bet that it is “oversold”. Of course, it if makes it to 90% down, it will still be a harrowing experience in the short term.
We like these catastrophes because they usually mean “the stuff is cheap and there is probably something people don’t see”. That’s definitely the case here, since one of the things that has been routinely ignored is the improvement in costs and cash flows that is slowly but surely progressing at many gold producers.
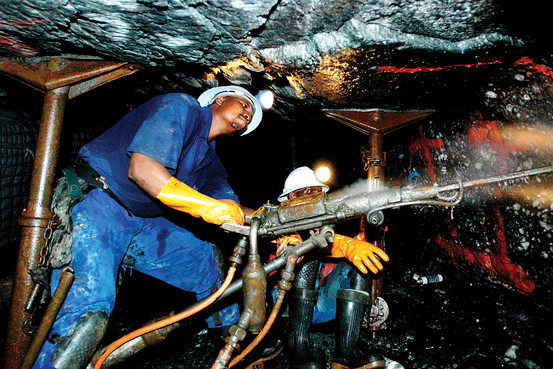
Going for the gold: rock driller at the world deepest gold mine, Mponeng, 40 miles from Johannesburg. You could stack 10 Empire State buildings on top of each other to cover the distance from its deepest point to the surface. It uses as much electricity as city of 400,000 people.
Photo credit: Graeme Williams / The New York Times / Redux
As always we will try to focus on slightly different things than in our last update on the sector, but there is one chart we want to show the current state of, namely our “divergences watch” chart.
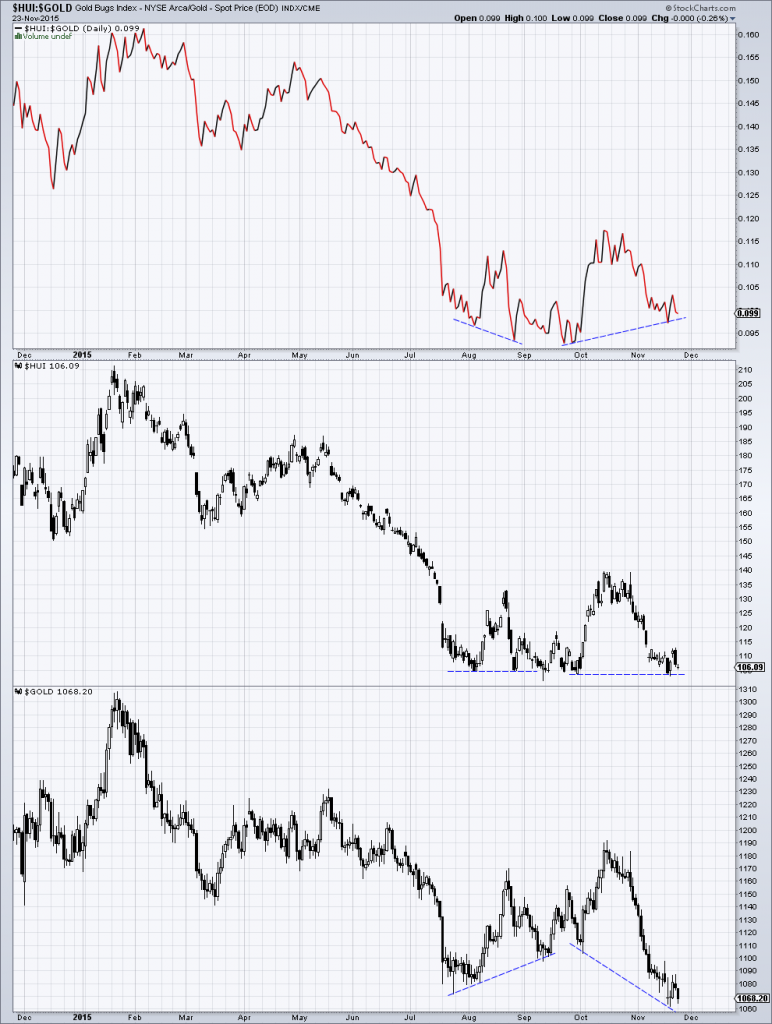
The HUI-gold ratio, the HUI and gold. So far, the “double divergence” remains intact – with alternating diverging lows. The support on which the HUI sits looks a bit vulnerable because it has been visited so often, but positioning and sentiment are more than ripe for a good rebound – click to enlarge.
While we’re waiting for the turning point, we are always interested in the potential for tradable rallies until it happens, because they tend to be so big in this sector. Just look at the last move from 104 to 140 in the HUI – that’s as if the DJIA went from its current level of 17,792 points to 24,000 points in just two and a half weeks. Will it do that? We doubt it. The HUI can – and not only that: it can rally that much and still be a few light years below its 200 day moving average. In short, these “small bounces” are really gigantic, because prices are so compressed and the sector is so small and illiquid.


Leave A Comment