
<< Read Part 1: Gold And Gold Stocks – Patterns, Cycles And Insider Activity
Cycles and Sentiment
Another recurring pattern consists of the seasonally strong period in gold around the turn of the year, which is bisected by a mid to late December interim low in the gold price. An additional boost can be expected in January and February from the strong seasonal uptrend in silver and platinum group metals as well (to see the seasonal PGM charts, scroll down to our addendum to this recent article by Dimitri Speck).
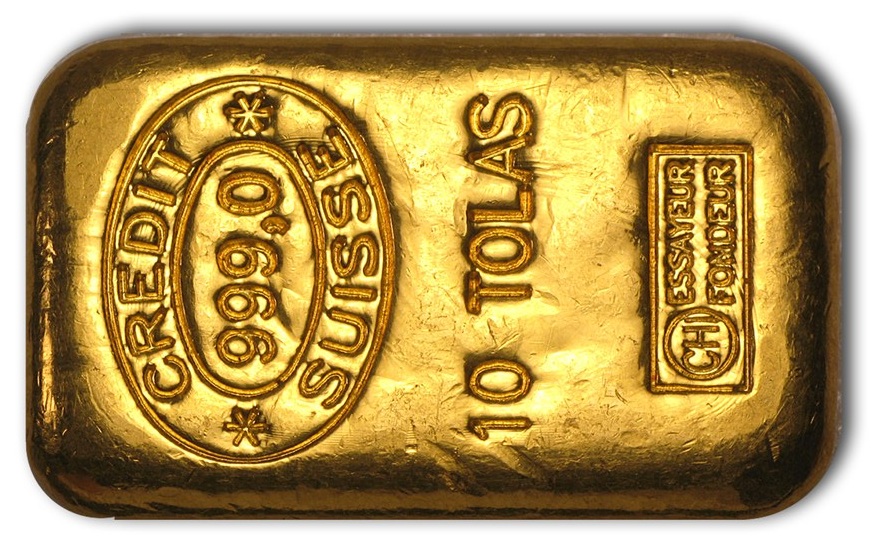
10 tola cast bar made in Switzerland for Asian markets.
Rallies in silver tend to be quite supportive for precious metals stock indexes, as silver stocks have an even higher beta than their gold brethren (note in this context that the XAU is the more broad-based of the two indexes these days and contains far more silver stocks than the HUI – see these lists of the current XAU and HUI constituents for details).
Below is the 20-year seasonal gold chart, with the period from the December 20 interim low to the late February peak highlighted. Note that the statistical data shown on the chart refer specifically to the highlighted period, which in turn is an average of the action at this time of the year over the past 20 years.
Obviously, there are years in which no gain is achieved in the seasonally strong period, but over the past 20 years, the probability that prices would rally was 70% (14:6 = 7:3). Moreover, while the gains in profitable years ranged from +8.52 to +17.98%, losses were much smaller, confined to a range of just -1.60 to -3.30%.
Interestingly, even if one averages only the performance of bear market years (i.e., years which close at a y/y loss), the period of strength still shows up during January. We suspect this is due to the exceptional seasonal strength in silver during this time period, gold probably tends to rise in sympathy.
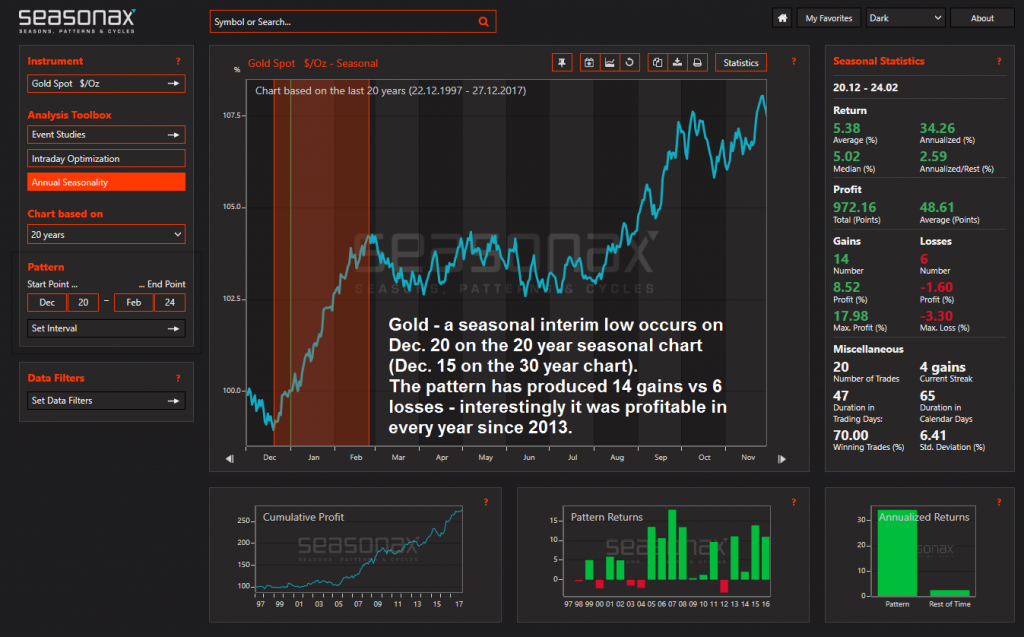
Gold, 20-year seasonal chart with all relevant statistics. The December interim low is close to the mid-December Fed meeting, i.e., in recent years the seasonal pattern and the “FOMC relief rally” were going hand in hand – click to enlarge.
The 20-year seasonal chart of silver exhibits, even more, strength over a slightly longer time period starting on the same date: the probability of a rally is 80%, and the average gain is 9.39% (profits ranging from +12.90 to +42.92%), which is a stunning 58.70% annualized.


Leave A Comment