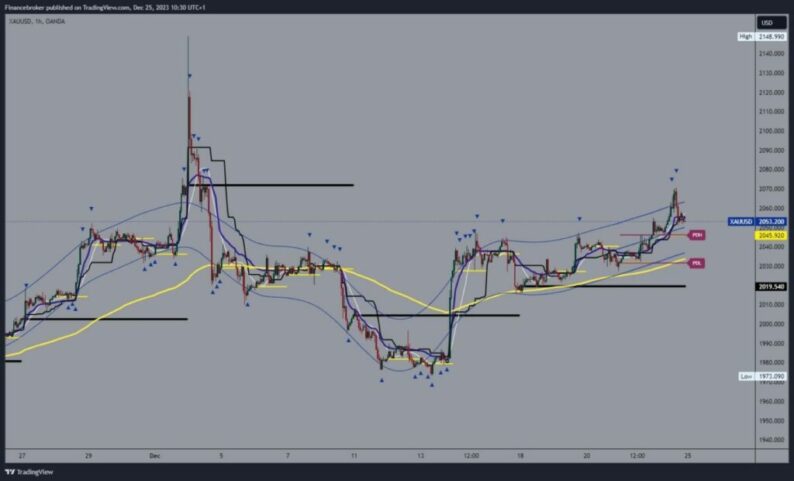
Gold chart analysisLast week was positive for the gold price by jumping to the $2070 level. We saw a successful bounce above the $2050 previous resistance zone. Now, it is important for us to maintain above it in order to start a further recovery on the bullish side. First, we would have to move above $2060, and after that, we would be able to test last week’s high. Potential higher targets are $2080 and $2090 levels.We need a negative consolidation and a price decline to $2040 for a bearish option. Thus, we would return below $2050, negatively affecting the price and increasing the bearish pressure. Potential lower targets are $2030 and $2020 levels. Gold could find support in the EMA50 moving average around the $2030 level.  Silver chart analysisThe price of silver was in a slight bullish consolidation last week. The movement took place in the $23.80-$24.60 range. We had support in the EMA50 moving average all week, which awaits us tomorrow at the $24.00 level. On Friday, the price closed at the $24.18 level, which can be interpreted as being close to testing support. New support would trigger a positive consolidation, and the price would have the opportunity to recover. Potential higher targets are $24.40 and $24.60 levels.We need a negative consolidation for a bearish option and then below the EMA50 $24.00 level. In this way, we would form this week’s low and get confirmation of the increase in bearish momentum. Such a scenario would trigger a further retreat of the price of silver to lower levels. Potential lower targets are $23.80 and $23.60 levels.
  More By This Author:GBP/USD Forecast: Navigating Key Support Levels
The Rollercoaster Ride: Asia-Pacific Markets React
Insights Into Asian Markets And Stock Market Predictions


Leave A Comment