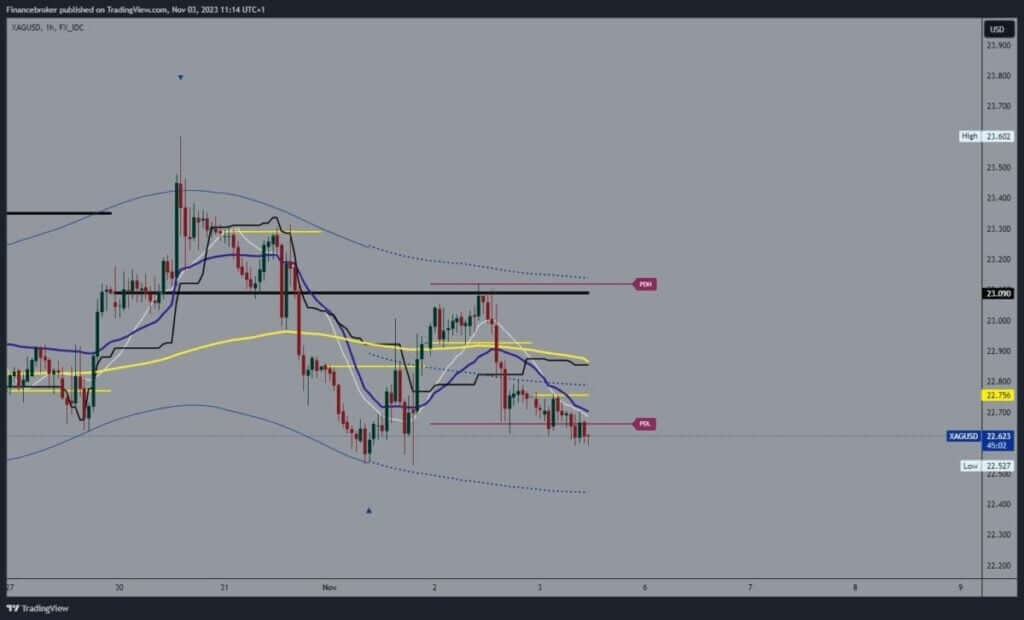
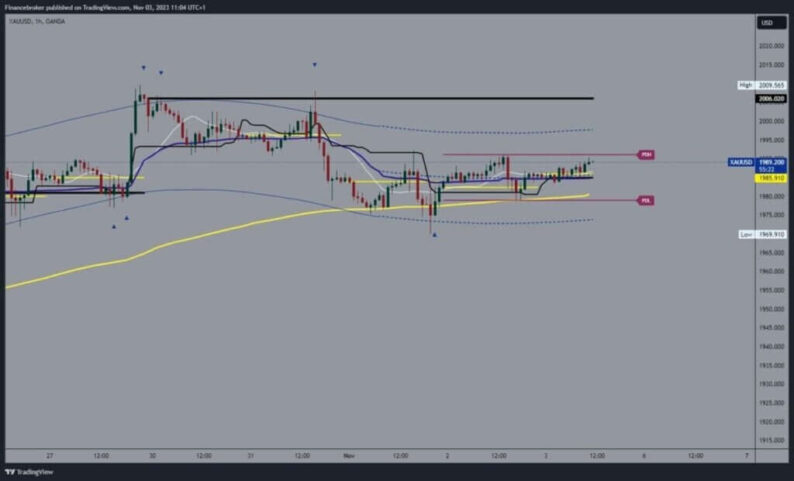
Gold chart analysisThe first part of this week was marked by a retreat of the gold price from the $2009 level. On Monday and Tuesday, we managed to stay above the $1995 level, and on Wednesday, we saw a breakout below and the formation of a weekly lower low at the $1969 level.In that zone, we tested the EMA50 moving average, and the price managed to return above it and gain the support of the moving average. From then on, we are holding above and climbing to the $1990 level.We are testing that level for the third time, and now we expect to see a break above and a continuation to the bullish side. Potential higher targets are $1995 and $2000 levels. For a bearish option, we need a negative consolidation and pullback below the $1980 level.There, we again test support in the EMA50 moving average. The breakout below confirms the dominance of the bearish trend, and the potential lower targets are the $1975 and $1970 levels.  Silver chart analysisThe price of silver is in bearish consolidation after climbing to the $23.60 level on Monday. On Wednesday, the November low was formed at the $22.52 level. We found support at that level and started a bullish consolidation up to $23.10. There, we encounter resistance again and start a new retreat. We are currently at $22.62 and very close to testing the previous support level.A break below confirms increased bearish pressure, and a new low price is in sight. Potential lower targets are $22.50 and $22.40 levels. For a bullish option, we need a positive consolidation and a move to the $22.90 level.There, we would have the opportunity to meet the EMA50 moving average. A break above could signal a continued recovery in the price of silver. Potential higher targets are $23.00 and $23.10 levels.
  More By This Author:Solana And Cardano: Solana Climbs To A New High At 46.97 Bitcoin And Ethereum: Bitcoin Is Approaching $36,000 Level Bitcoin And Ethereum: Bitcoin In Sideways Movement


Leave A Comment