So much excitement but by the end of the month…
Some high-/low-lights for February…
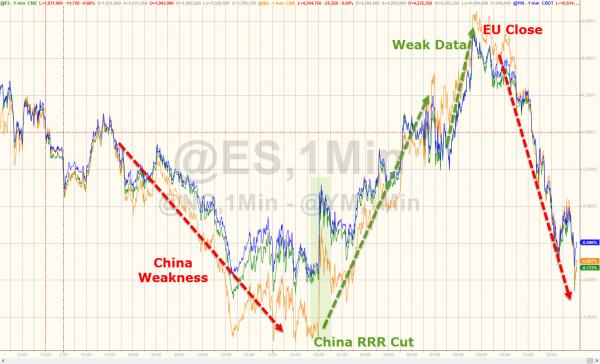
We’re going to need another RRR cut…

S&P 1940.25 was all that mattered today (the line between a red or green close for Feb)

On the day, we roundtripped from early exuberance on terrible data… NOT off the lows…
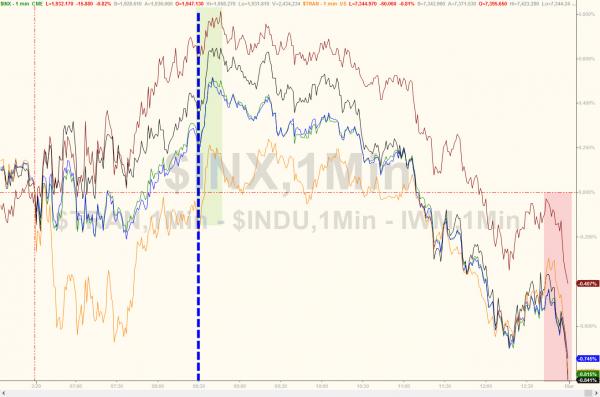
Leaving stocks practically unchanged (Nasdaq underperforming with The Dow eking out a small gain) except for Trannies’ huge surge…
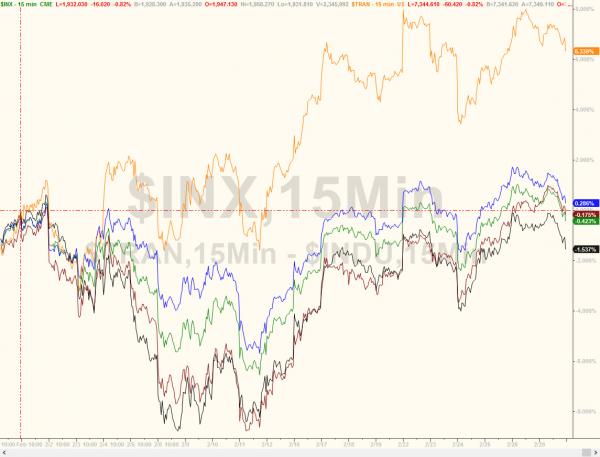
Financials and Energy were among the weakest performers today with Utilities the only sector green on the day. But on the month Materials (QE hope?) dramatically outperformed as Energy and Financials slumped…

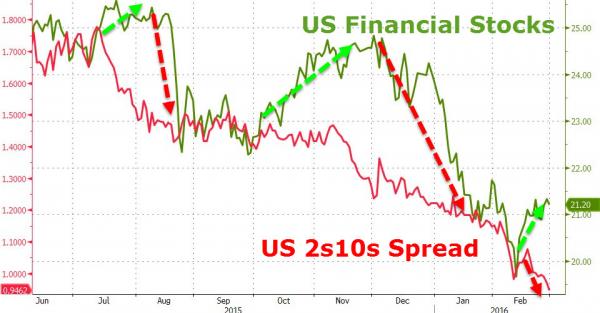
While financials ended the month lower (3rd month in a row for the first time since 2011), they rallied higher off the Dimon Bottom, decoupling again from yield curve reality…
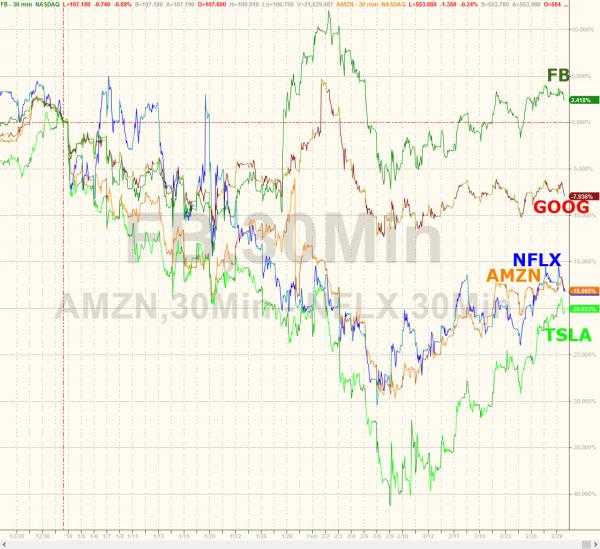
FANGs bounce in the second half of Feb but only FB remains green for 2016…
VIX bounced to the tick off the 200DMA…


Leave A Comment