
After a positive year-end with the expected precious metals rally we noted on Dec. 31, in NFTRH 480:
“With HUI dwelling just under the 195 resistance parameter, a pullback can come at any time. But there are enough other factors still in line to expect a resumed rally after any grind at resistance comes into play.”
and then on Jan. 7, in 481:
“What HUI actually did was immediately push up into the 195-200 resistance zone, become overbought and hang around there all week in consolidation. Here is the noisy daily chart once again. Let’s focus on how the most recent RSI oversold condition in December did indeed spring a tradable rally. As chartists saw the October/November shelf of support break down and then the July lows breached the call was ‘BEARISH!’ far and wide. Shorts were taken on the say so of people who know how to look laterally and see one thing lower than the other thing.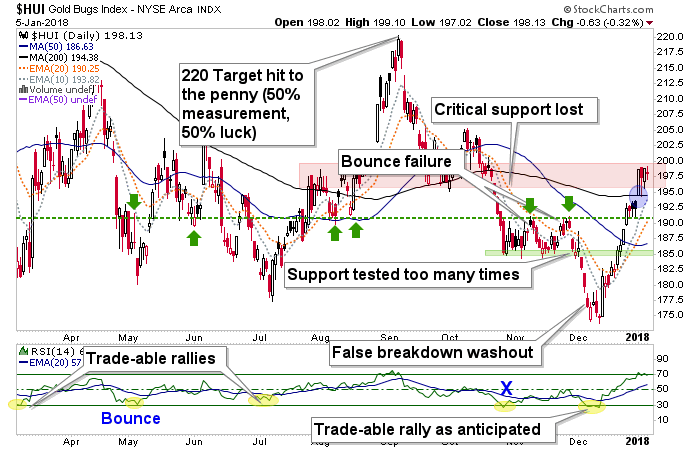
Yes, that is a swipe at charting in a vacuum. There were other things in play like sentiment, seasonals and a rapidly improving Commitments of Traders. The other thing we had going for us was a backlog of experience. Simply as a human (as opposed to a chart reader) I’d seen trap door washout whipsaws in this sector all too often. In 1st half December, the bottom was in.
While my gut says there is more rally to come, we are at the ‘bounce’ target of 195-200 and traders who do not care about scouting new bull markets or the like, should have taken profits in that zone. I simply took a few profits, but hold positions still. Huey could test the SMA 200 (black) and fill the gap (blue shaded oval above) and possibly test the green dashed support line before another leg up if another leg up is coming.”
We have been on this rally since chartists far and wide sounded the alarm on the false breakdown and whipsaw that cleaned out the sector in mid-December. See December 15’s Amid Bad Fundamentals Gold Sector Rally May Have Begun.


Leave A Comment