
We are getting very close to what I believe is the final confirmation of the coming multi-year gold bull market. Although it is very clear that gold is going higher from around these levels, a move pass the $1 375 area would be that final confirmation, based on the update of this previously shown comparison:
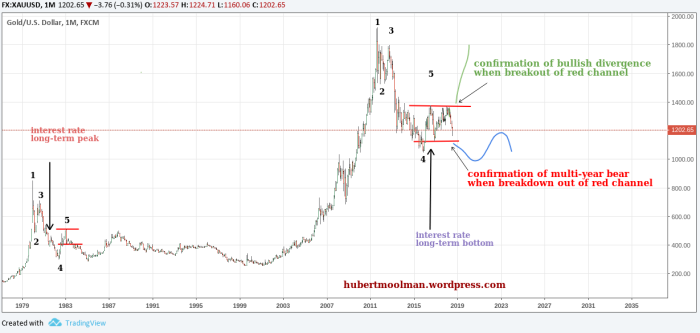
I have marked two fractals (patterns) 1 to 5, to show how they might be similar. I have also marked the point where interest rates peaked (in 1981), and where they probably bottomed (in 2016).
If the comparison with the 1980s pattern is justified, and the current pattern continues in a similar fashion, then gold will continue in a long bear market. However, there are just too many fundamental obstacles to such a scenario (interest rates being one of them), since gold appears to be ready for the next phase of the bull market which started around 2000.
A breakout at the top red line (the high at point 5 – $1 375) would almost certainly signal or confirm the bull market. This would be a divergence from the 1980s pattern, and likely cause prices to rise really fast once the breakout is confirmed (when dealing with fractals, the biggest price movements occur when two fractals diverge – a breakout at the top red line is a divergence).
This, in my opinion, is the most likely outcome.
A breakdown at the bottom red line, could mean that prices will continue to follow the 1980s pattern, and go lower than $1000. Which would mean we will have to wait many years (even a decade) for the next gold bull market (very unlikely).
The movement between the two red lines will probably not persist much longer – we are likely to see a resolution by the end of September 2018.


Leave A Comment