
With the US Dollar in the midst of its worst stretch of the year – having lost ground in nine of the last 10 sessions, today included – Gold prices have been able to post a meaningful rebound from their yearly lows. As discussed last week, the US Dollar is the single most important factor driving Gold at the moment – neither the US-China trade war nor the Turkish Lira implosion have had nowhere close to the same impact in recent weeks and months.
While Gold’s long-term charts haven’t changed that much over the past week (see last week’s update for multi-month views), there has been an important development in recent days that is worth calling attention to. As previously observed, Gold had been holding below its daily 13-EMA for over two months, last posting a close above said moving average on June 14.
Gold Price Chart: Daily Timeframe (June to August 2018) (Chart 1)
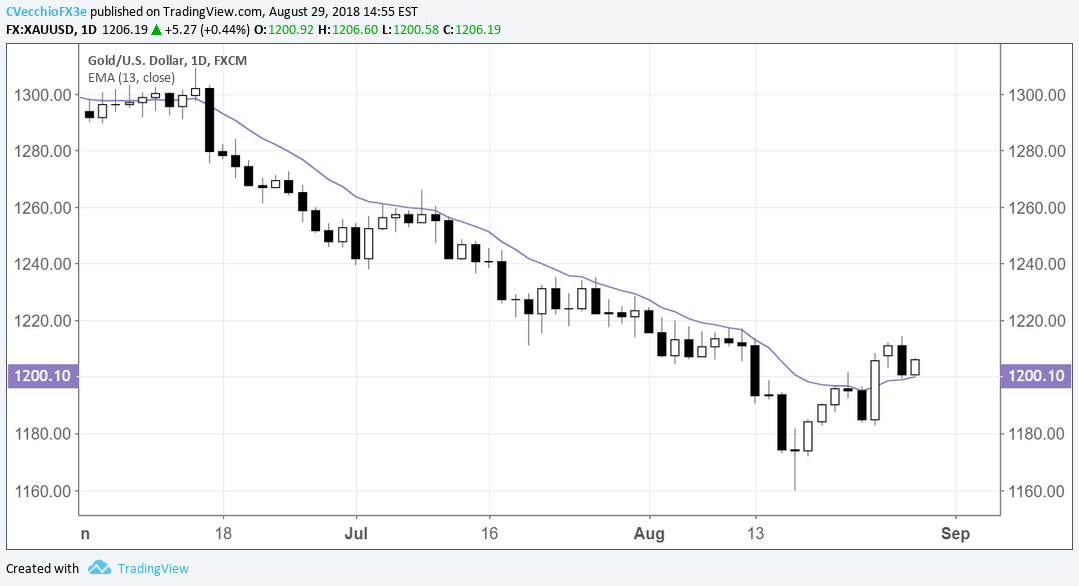
However, the run below the daily 13-EMA officially came to an end on Friday, August 24, with price posting a bullish outside engulfing bar to close out the week. Despite yesterday’s bearish outside engulfing bar (or key reversal, depending upon your perspective), we saw the daily 13-EMA serve as support. Today, price has rebounded, with the daily 13-EMA serving as support once again.
The quick transition of the daily 13-EMA from resistance to support calls attention to a possible change in trend. In line with our outlook from last week, the break above the daily 13-EMA shifts Gold’s near-term outlook from ‘bearish’ to ‘neutral.’ It still holds that the only scenario in which a legitimate bullish bias (beyond a near-term scalping opportunity) would materialize would be if price were to overtake 1236.37, the December 2017 swing low that quickly morphed into resistance once broken on July 17.
IG Client Sentiment Index – Spot Gold (August 29, 2018) (Chart 2)
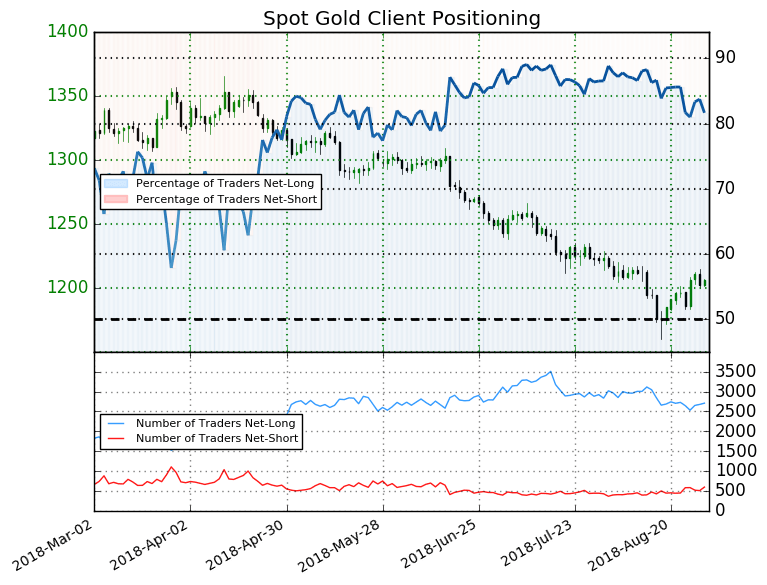
Recent changes in sentiment figures support the upgraded outlook for Gold in the near-term. Retail trader data shows 81.6% of traders are net-long with the ratio of traders long to short at 4.45 to 1. The number of traders net-long is 0.1% lower than yesterday and 0.1% higher from last week, while the number of traders net-short is 15.1% higher than yesterday and 29.3% higher from last week.


Leave A Comment