What drives the price of gold?That’s a fascinating question, which is the subject of an article asking that exact question at Investopedia. We’re going to cut straight to their bottom line answer:
Today, the demand for gold, the amount of gold in the central bank reserves, the value of the U.S. dollar, and the desire to hold gold as a hedge against inflation and currency devaluation all help drive the price of the precious metal.
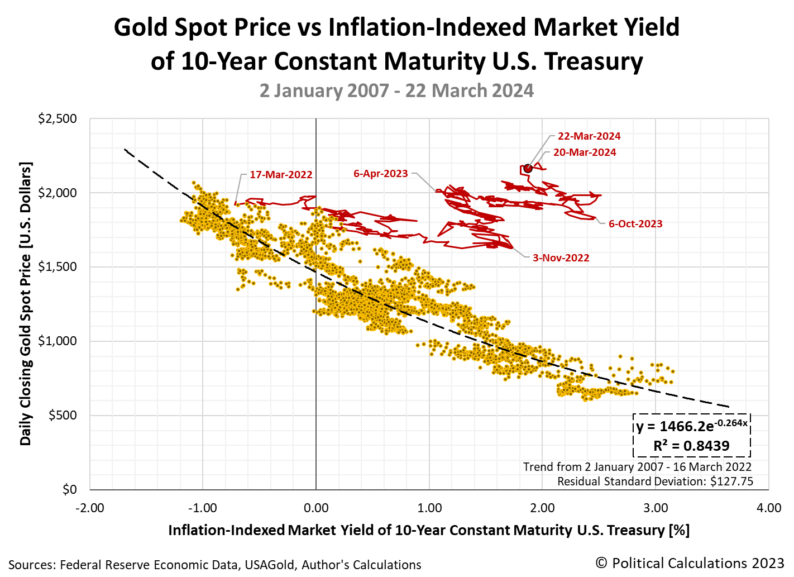
We have a unique perspective on this topic because of the fortunate timing of a snapshot we took mapping the recent historic relationship between the spot price of gold and real 10-Year U.S. Treasury yields some two years ago. That snapshot covered the period from 2 January 2007 to 17 March 2022, which is significant because a new paradigm for gold prices took hold starting on that latter date.Two years later, this new paradigm can be seen in the following update to our chart, in which how the price of gold has changed with respect to the inflation-adjusted yield of the 10-Year Treasury is shown by the red line. The big thing that stands out in the chart is that the price of gold has been rising even though the inflation-indexed market yield of a 10-Year U.S. Treasury has also risen during this period as the rate of inflation has fallen. This pattern contradicts the previous paradigm, in which gold prices rise as high inflation makes real yields fall or even turn negative in value, while a low inflation rate has the opposite effect. In the old paradigm, there is an inverse relationship between the two.The other thing that stands out is the periodic changes in the direction of gold prices with respect to real 10-Year Treasury yields. We’ve marked the dates of the most significant turning points in the new paradigm on the chart.We next mined through the market-moving headlines we’ve been capturing for years as part of our ongoing S&P 500 chaos series. While we seek to record headlines that have the potential to affect stock prices, it turns out we’ve also captured the events that proved to be major turning points for gold prices in the new paradigm. Here are the notable headlines occurring within a trading day of the indicated date on the chart marking the turning points:
For that last headline, gold prices broke through the $2,200 per ounce level to record an all-time high in terms of U.S. dollars. As of the final data point for the snapshot, we find gold prices hovering just a little below that level.What all these headlines have in common is they herald actions by the U.S. Federal Reserve to alter the course of monetary policy in the United States. In the new paradigm, when the Fed alters its direction, investors alter the trajectory of gold prices.ReferencesFederal Reserve Economic Data. Market Yield on U.S. Treasury Securities at 10-Year Constant Maturity, Inflation-Indexed. [Online Database (Text File)]. Accessed 24 March 2024.USAGold. Daily Gold Price History. [Online Database]. Accessed 23 March 2024.More By This Author:S&P 500 Rockets To New High As Fed Confirms Rate Cuts Are ComingSmall Changes In Trends For U.S. Teen Employment Quarterly S&P 500 Dividend Futures Rise, Signal Potential Turbulence Ahead


Leave A Comment