
Mounting geo-political tensions with North Korea and the recent increase in market volatility has continued to fuel demand for the perceived safety of gold with prices continuing to plow higher since early-July. Weakness in the greenback has also contributed to the rally with bullion prices up more than 14% year-to-date. That said, we’re now approaching a region of technical resistance which may cap the advance near-term.
Gold Daily Chart
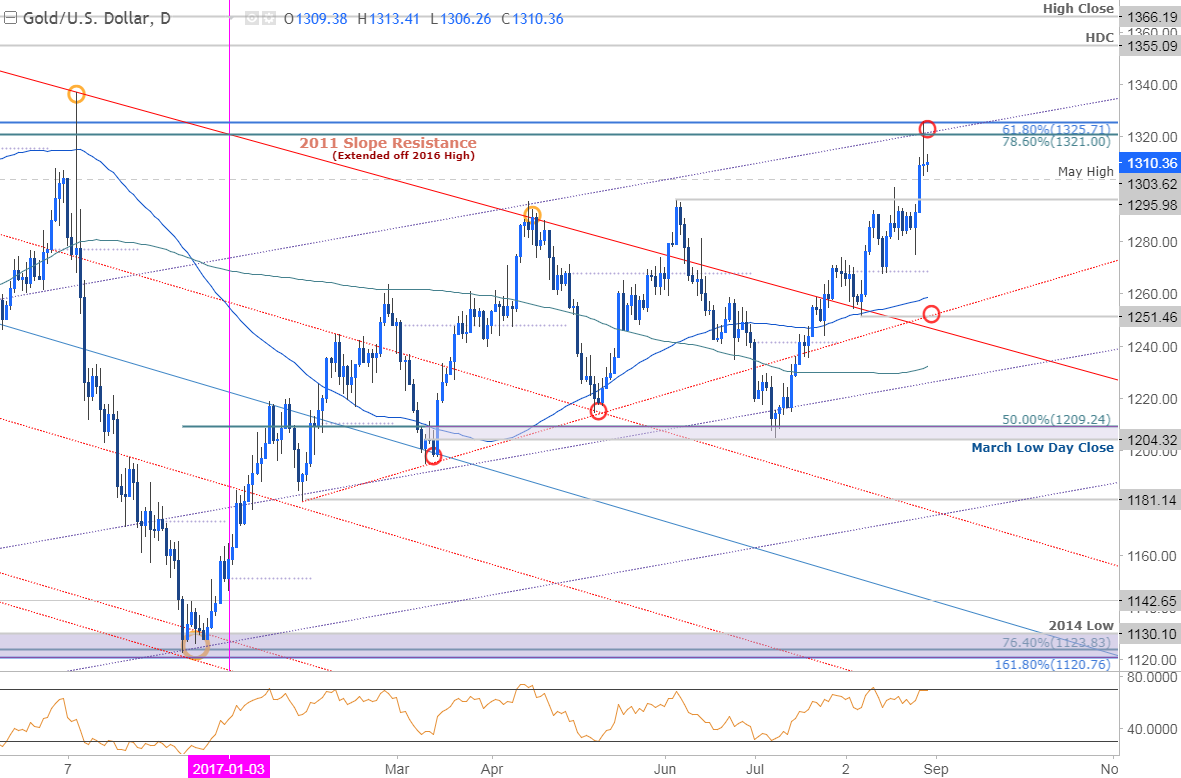
Technical Outlook: Gold tested a critical resistance confluence yesterday at 1321/25– a region defined by the 78.6% retracement of the 2016 decline and the 61.8% extension of the advance off the 2015 low. Note that parallel resistance (purple) also converges on this zone and further highlights the technical significance of the region- the immediate long-bias is at risk while below this threshold heading into the close of the month.
Gold 240min
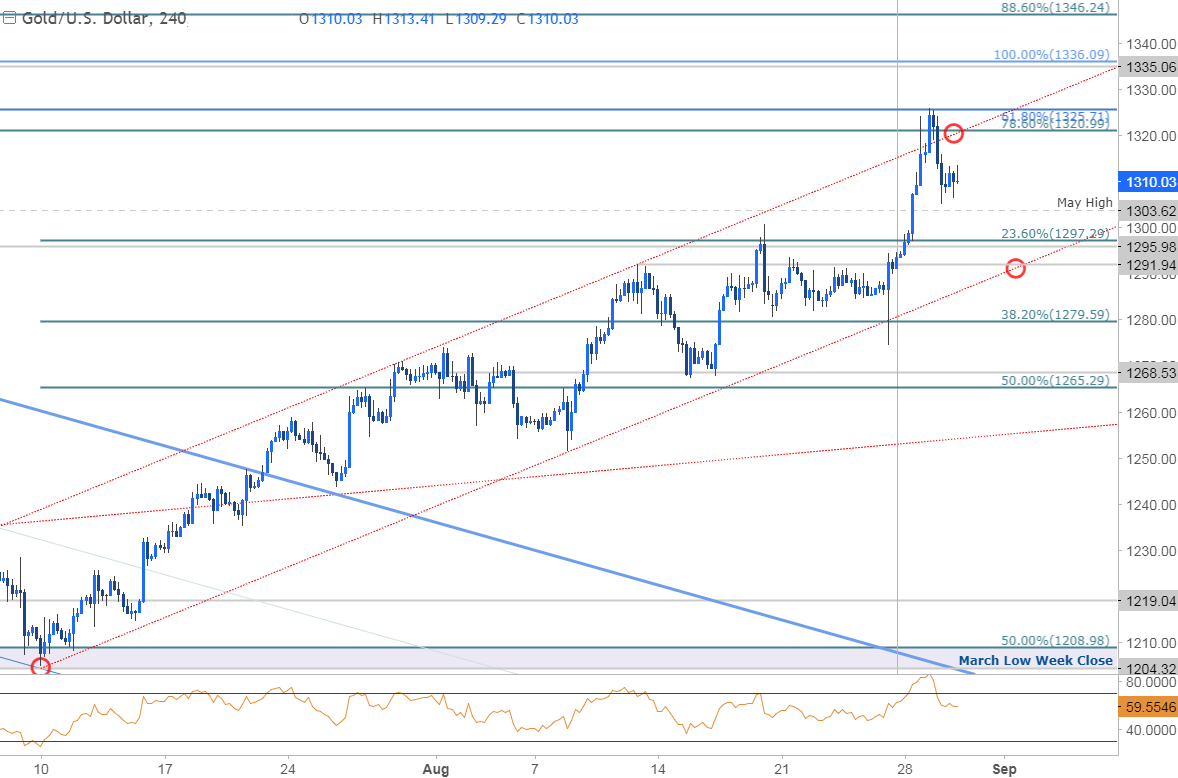
Notes: In last week we noted that gold prices were trading within a well-defined ascending channel formation extending off the July lows and heading into the start of the week our focus remained weighted to the topside,“while within this formation with bullish invalidation now raised to the monthly open at 1268. Interim resistance stands at 1295 backed closely by 1303- a breach there is needed fuel the next leg higher targeting 1321/25.”
The reaction seen at the 1321/25 resistance zone shifts the near-term focus towards support targets at 1303 & 1295/97. Near-term bullish invalidation now raised to 1291. A breach higher from here keeps the long-bias in play targeting 1335/36 backed by 1346 & 1356. Bottom line: While the immediate risk is for a pullback off these levels, I’d be looking for a reaction near channel support with the broader outlook weighted to the topside while within this channel.


Leave A Comment