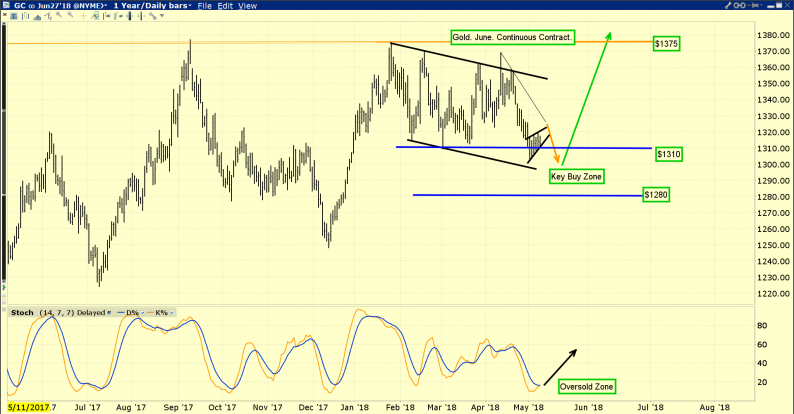
Gold has traded in a drifting rectangle pattern for most of this year.
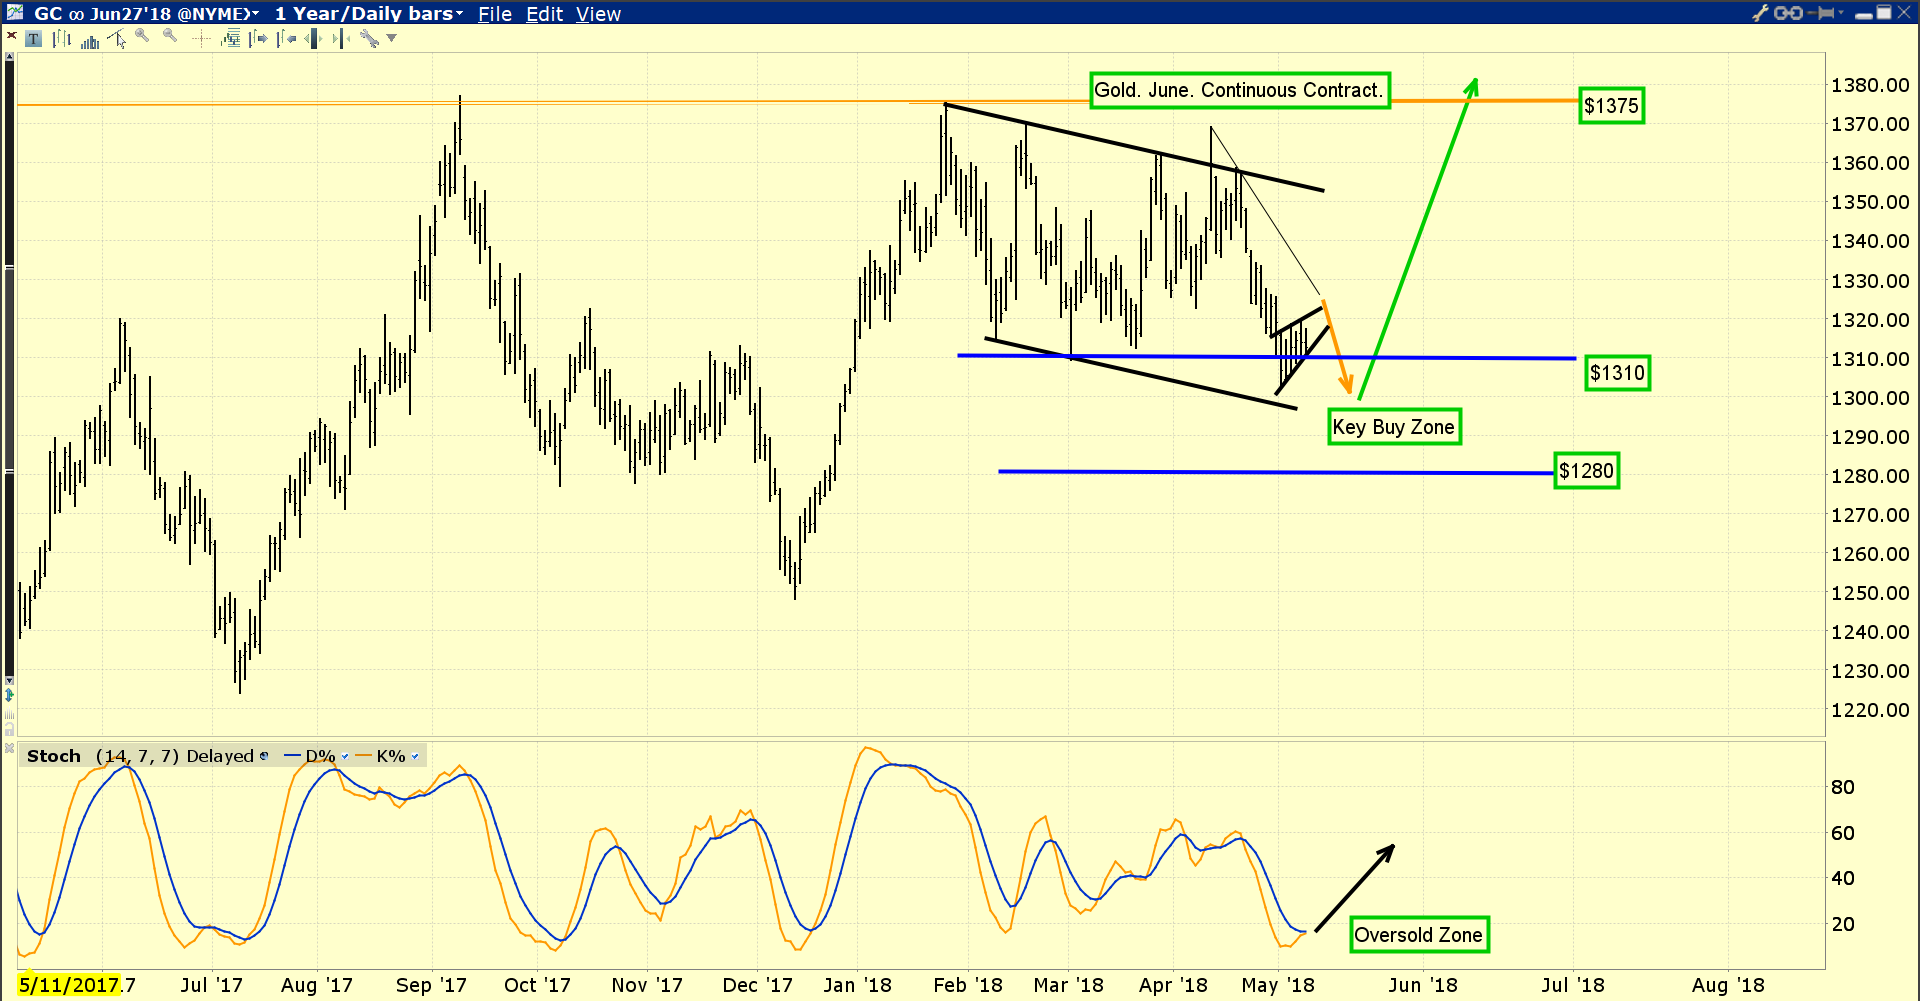
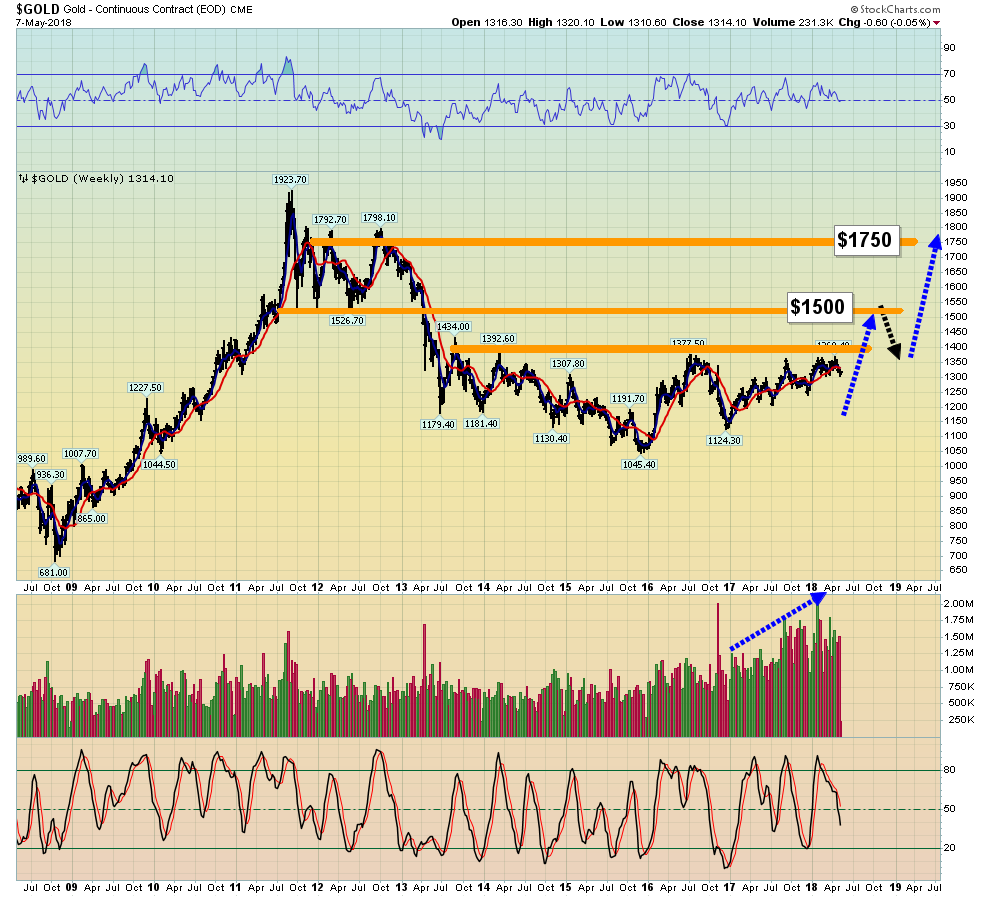
The rectangle pattern on the daily chart is part of a huge weekly chart base pattern. That has been forming for about five years.
Note the enormous increase in trading volume over the past two years. This is extremely positive technical action.
Trump appears ready to make an announcement concerning US government relations with Iran today. That could re-open the oil-for-gold trade in Turkey and other countries.
It’s unlikely that anyone in China really cares very much about what the US government announces today, tomorrow, or in the future, and rightly so.
In another five years it’s unlikely that anyone in India will care what the US government does either.
This is the beginning of what I call the China and India oriented “gold bull era”. It’s an era that is rekindling respect amongst global money managers for gold as the ultimate asset and portfolio returns enhancement tool.
I’m adamant that the correct minimum amount of gold that should be held in a stock and bond portfolio to maximize returns is 20%. The ideal portfolio may be 30% bonds, 30% stocks, 30% gold, and 10% blockchain.
Regardless, long term precious metals investors should ignore short term market noise and focus on the big weekly chart base pattern for gold. Note the price targets of $1500 and $1750.
That’s where to book some profits and/or buy put options in expectation of a significant pullback in the price.
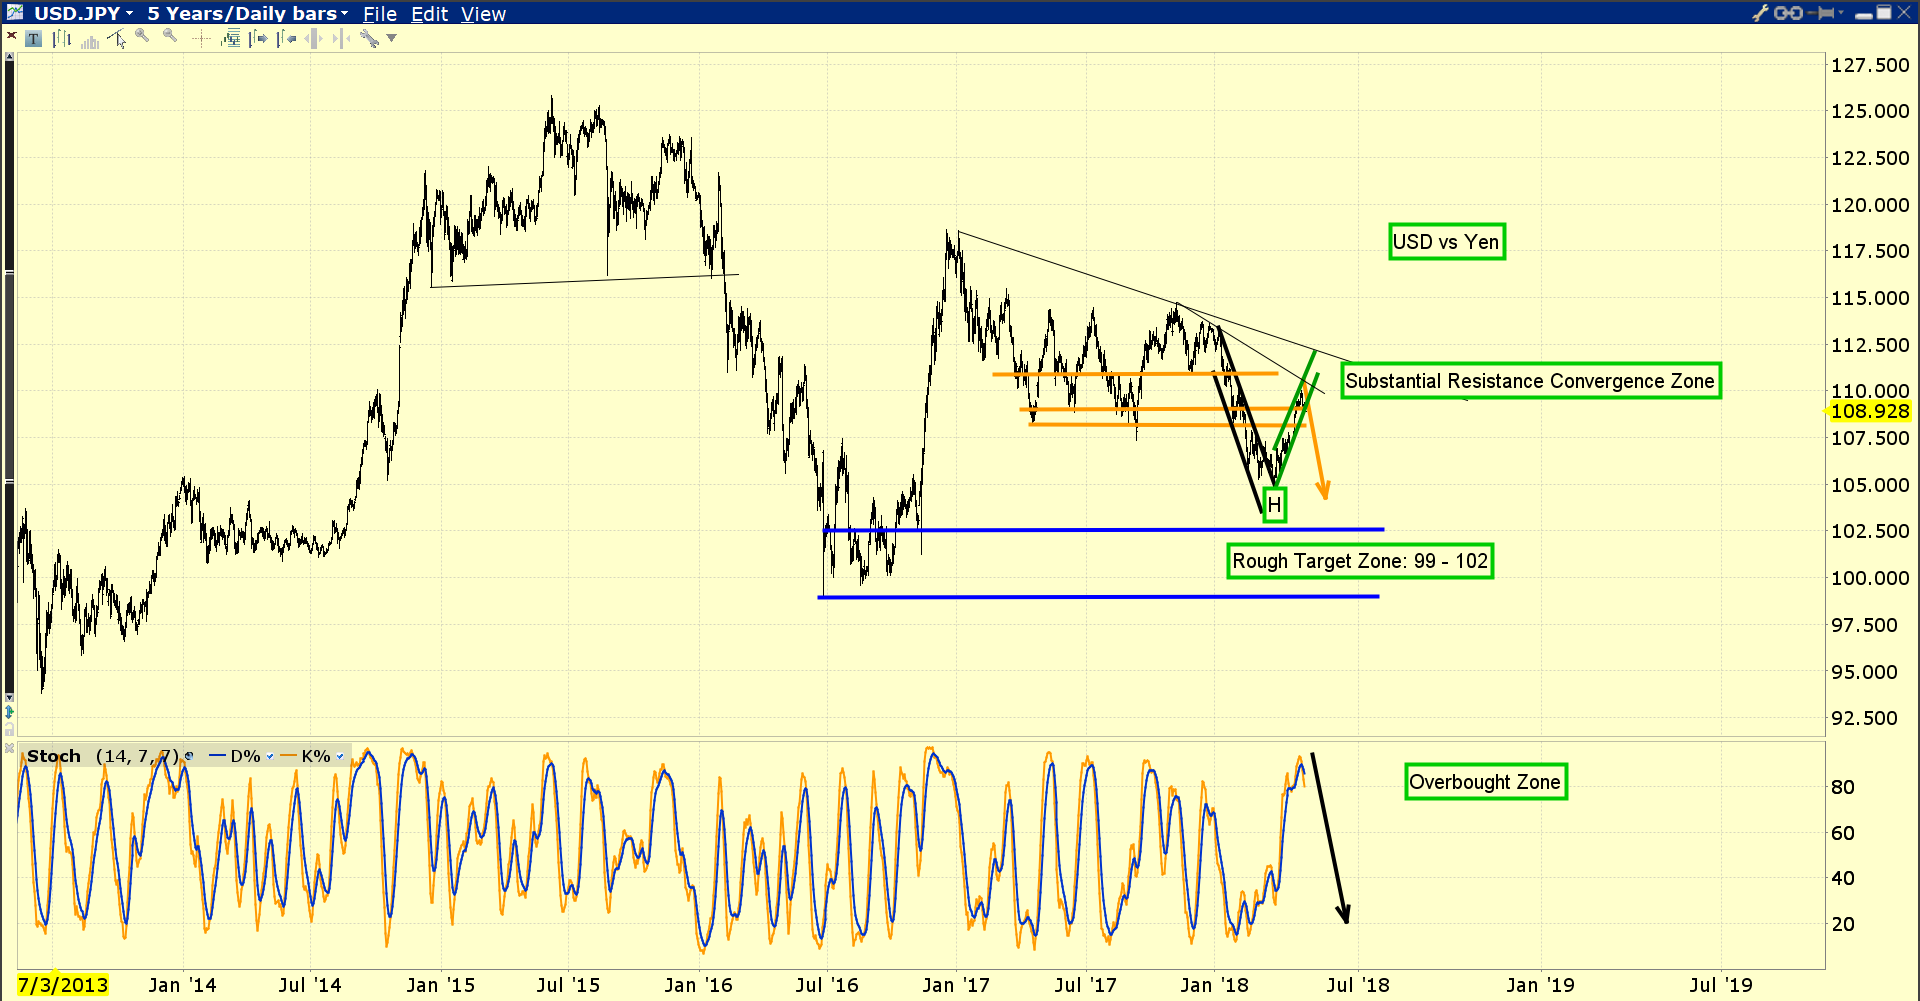
Another bear market rally for the dollar is nearing completion. That bodes well for a gold price surge towards my first target at $1500.
Most analysts claim the dollar is rallying because of rate hikes, but the cold truth is that the dollar has collapsed after almost every recent rate hike.
I’m projecting this trend will continue and likely accelerate.


Leave A Comment