I am very bullish on the gold price in 2017 and while the year has got off to a cracking start I believe we need to see a test of the recent low to lay a stronger foundation from which to launch even higher.
Let’s review the charts beginning with the long term picture.
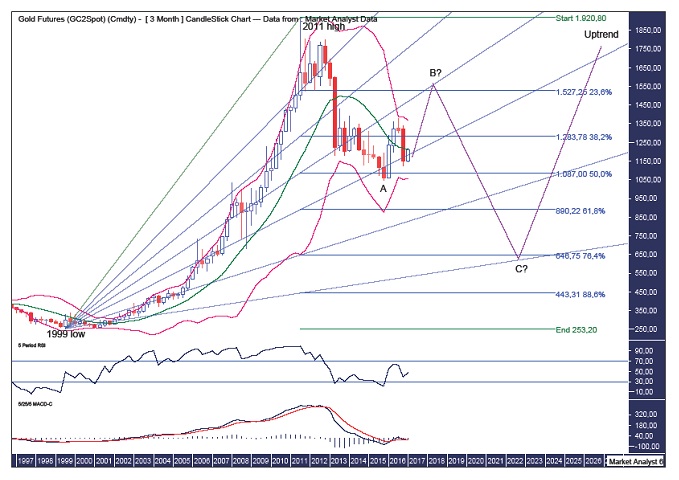
GOLD QUARTERLY CHART

There is no change to the longer term outlook whereby I believe an ABC corrective pattern is in play with price currently tracing out its way to a wave B high.
The Bollinger Bands show price giving support from the middle band a good test and I expect price to eventually move back up to the upper band and push even higher into that band to set up the final rally high.
I have drawn a Fibonacci Fan from the 1999 low to 2011 high. This shows price finding support around the 61.8% angle and I expect the wave B high to be up at resistance from the 50% angle. After that, I am currently targeting the wave C low to be around support from the 88.6% angle, most likely during the next decade.
I have added Fibonacci retracement levels of the whole move up and while price has currently found support from the 50% level I believe the final wave C low will be closer to the 76.4% level at $646. Price hitting the 61.8% level at $890 is my minimum expectation.
The RSI is still in weak territory while the MACD indicator looks to have regrouped somewhat after its downtrend.
GOLD MONTHLY CHART
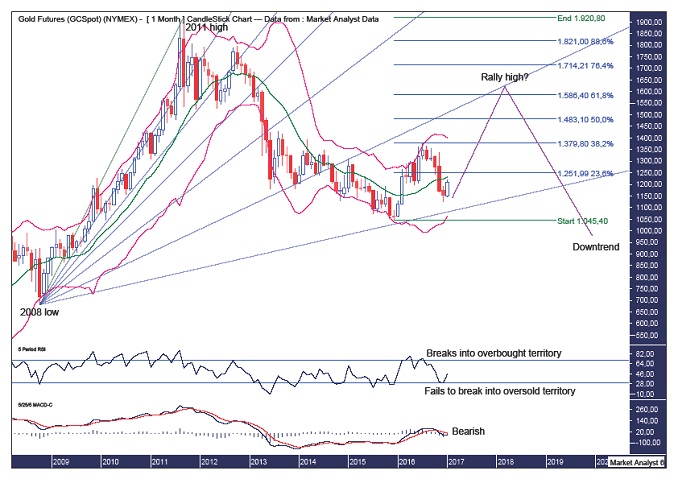
The Bollinger Bands once again show price giving support from the middle band a good test and price now looks to be fighting back.
The Fibonacci Fan drawn from the 2008 low to 2011 high shows this rally taking place between the 76.4% and 88.6% angles and I favour the final rally high to be around resistance from the 76.4% angle.
I have added Fibonacci retracement levels of the move down from the 2011 high and my forecast remains unchanged whereby I believe price will clip the 61.8% level at $1586 before resuming the downtrend.


Leave A Comment