A couple of weeks ago in an article and again in a video made yesterday, I discussed the prospects of higher gold following the conclusion of the two-day FOMC meeting ending tomorrow. The thesis is built on a foundation of confluences between technical and market positioning/sentiment factors aligning with a major fundamental catalyst. Today we will look at it in a bit more detail…
Market positioning very favorable for rally
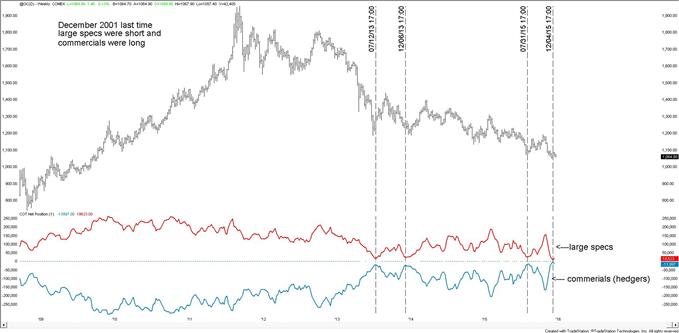
Futures markets, through the Commitment of Traders report (COT), show large speculators (hedge funds), in aggregate, holding their smallest long position in over a decade after weeks of quickly abandoning their long bias on rising speculation of a December “lift-off’. Commercial traders (hedgers) covered nearly all their short hedges (smallest in 15 years), indicating they do not believe they require as much protection at this time against further price erosion.
Gold/ COT Weekly: 2001 – Present

Support and pattern development offer price references
The extreme shift in market positioning coincides with a pair of long-term bottom-side trend-lines. (Drawn below in two degrees, daily/weekly.) Furthermore, an ‘inverse head-and-shoulders’ pattern has been under development for the past month.
Gold Weekly: Jun ’13 – Present
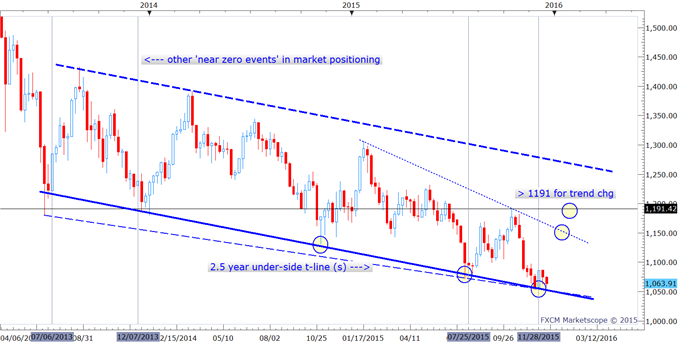
The inverse ‘head-and-shoulders’ formation will be triggered on a daily closing bar above 1088. The height of the pattern points to an approximate move of $43, or target of 1132. Although, given the extreme in positioning the potential for a larger advance is certainly there.
If the pattern does not trigger and sellers emerge, then the targeted area of support once again becomes the under-side trend-line(s) in the 1045/35 vicinity. Should we reach those levels we will wait for some type of sign the market wants to reverse. This signaling could come by way of a key reversal bar, engulfing bar, or some other bullish technical event which we can hang our hats on.


Leave A Comment