Ok, Goldman is out on Wednesday with a visual update on their outlook for stocks and it comes complete with their breakdown of the “phases” the rally has gone through on the way to record highs.
This is always amusing because depending on the timestamp you choose for the start of the second “phase” (or really, whether you break it down into “phases” at all), you can paint a picture of a market that’s living on multiple expansion.
Here’s the 30,000 foot view from Goldman:
So that’s the same story you’re used to hearing. A disconnect between policy uncertainty and market volatility and valuations that are pushing the limit.
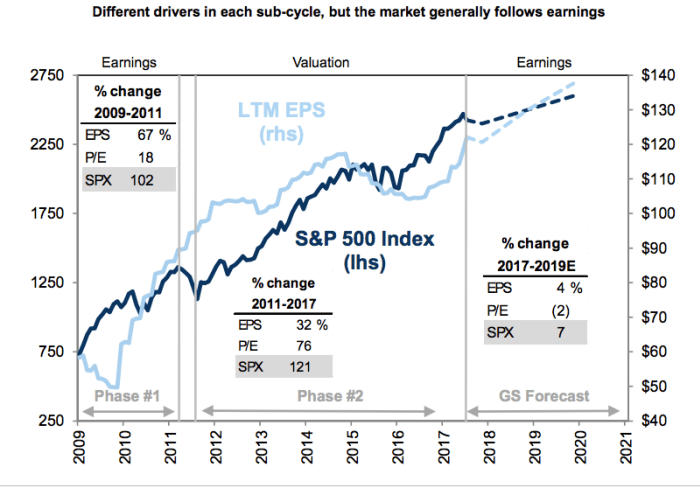
But here’s the breakdown mentioned above:

Again, what you want to look at is that second phase. Between late 2011 and now, the lion’s share of the S&P’s performance is down to multiple expansion, not earnings growth. And the problem going forward (i.e. the forecast bit) is that multiples are expected to contract. Put differently: earnings better not disappoint if stocks are going to rise.
Either way, you’ll note that the forecast is for diminishing returns through 2021.
So far, “this time has been different”:

As you can see, that’s probably attributable to the painfully slow pace of the current hiking cycle which leads directly to the following question: what happens to multiples if the pace picks up?


Leave A Comment