
All pundits need something really good or really bad to write about. Few want to read analysis saying the porridge is just right. 2015 was not overall a good year for USA investors. Economically, the USA saw only weak growth.

In 2014, stocks, home prices, industrial production, and consumer spending annual growth was in the range of 5% or better.

Fast forward to 2015 with reporting and backward revisions for the year still accumulating – the best growth is still only half of 2014 (except home appreciation).

The concern I have is that the more rapid growth rates seen since the end of the Great Recession are now in the rear view window as shown by the relatively poor growth seen in 2015. Loose monetary policy was marginally tightened – but it occurred too late in the year to see any affect. Fiscal spending growth was relatively flat. Consumer spending was the only relative strength inside of GDP. Home price appreciation was very good with more and more homes above water.
Next week I will look into the crystal ball for 2016.
Other Economic News this Week:
The Econintersect Economic Index for December 2015 declined – and remains in the low range of index values seen since the end of the Great Recession. The most tracked sectors of the economy generally showed some growth. Still our economic index remains in a long term decline since late 2014.
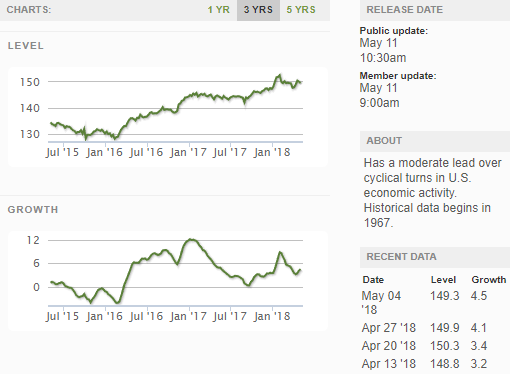
Current ECRI WLI Growth Index
The market (from Bloomberg) was expecting the weekly initial unemployment claims at 260 K to 278 K (consensus 270,000) vs the 271,000 reported. The more important (because of the volatility in the weekly reported claims and seasonality errors in adjusting the data) 4 week monetary policy moved from 270,750 (reported last week as 270,750) to 270,500. The rolling averages generally have been equal to or under 300,000 since August 2014.
Weekly Initial Unemployment Claims – 4 Week Average – Seasonally Adjusted – 2011 (red line), 2012 (green line), 2013 (blue line), 2014 (orange line), 2015 (violet line)


Leave A Comment