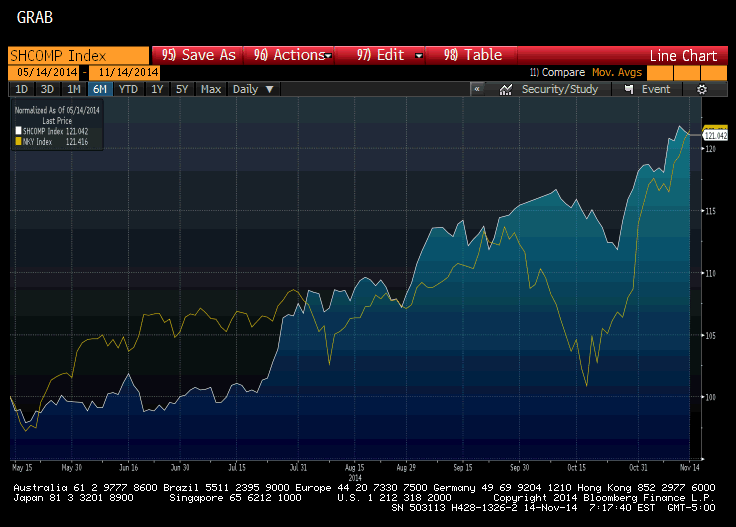
This Great Graphic was generated on Bloomberg. It show the performance of the Shanghai Composite (white line) and the Nikkei (yellow line) over the past six months. The performance has been indexed so as to help capture the relative performance.
Click on picture to enlarge

Over the past six months, both indices have risen a little more than 21%. Year-to-date, though there is a different story. The Shanghai Composite has risen a little more than 17%, while the Nikkei has gained a little less than 7.5%.
There seem to be two key drivers of the Shanghai Composite. First, as the government pushes against shadow banking and wealth management products, it is encourages domestic risk capital to be invested in the equity market. Second, and more important recently is Shanghai-Hong Kong equity link that will allow Hong Kong equity account to buy stocks that trade in Shanghai, albeit limited to a couple billion dollars a day. At the same time, Shanghai equity accounts will be able to purchase Hong Kong-listed stocks.
I have generally thought that most of the talk of the internationalization of the yuan has been hyperbole. The often cited swap lines have not been used. Some talk about the rise of the yuan to settle trades and often cite the SWIFT data. It share may have tripled over the past year, but its share is still less than 2%. The different offshore trade hubs (Canada has recently been granted this privilege) is only meaningful because of China’s closed capital account and heavily managed currency regime.
China, and many observers, want to have it both ways. Hong Kong is a part of China, yet they want to say that more of the “trade” is settled in yuan, and somehow, this counts as internationalization of the yuan. No other country counts the movement of goods and services within its own country as trade. Economists wouldn’t let them, but China is an often unexamined exception.


Leave A Comment