
 Image Source: Pixabay
Despite continued inflation, the consumer wants to celebrate the spooky season. Online Halloween merchandise is selling out on par with last year’s level, and faster than the pandemic and pre-pandemic levels. Given the mix of discounts, it looks like retailers might be able to maintain healthy margins.Moreover, the LSEG I/B/E/S and StarMine data indicate that candy makers Hershey and Mondelez International are better poised to do well during this trick-or-treating season, despite higher cocoa prices.
Halloween discounts
In collaboration with Centric Market Intelligence, LSEG discovered that the discount penetration, which means the percentage of Halloween-related costumes and accessories on sale, has risen to 65% from last year’s 53% (Exhibit 1).The average discount for Halloween costumes and accessories is 16%. This is also above last year’s 12% and back to pre-pandemic levels. Thus, there’s more Halloween apparel on sale this year, and its average discount level is also higher, suggesting retailers are betting that values will increase customer demand in this category.
Exhibit 1: Avg. Discount and Discount Penetration for Halloween Costumes & Accessories 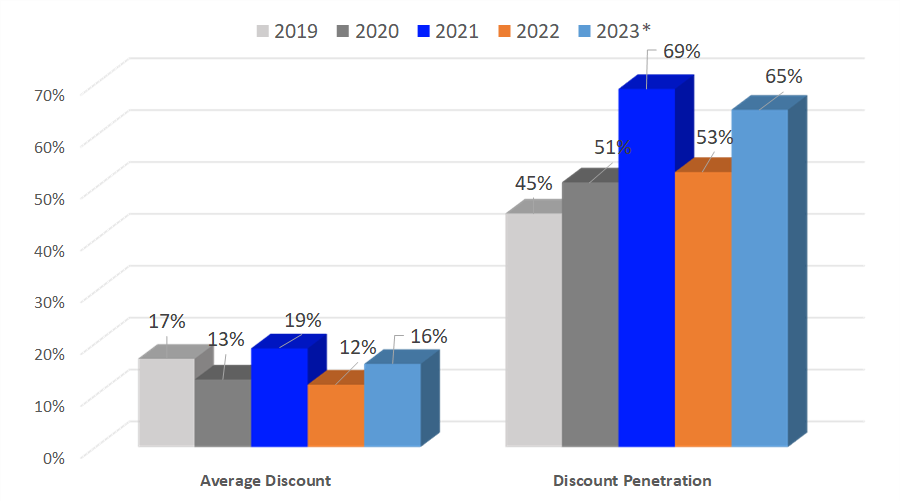 *2023: This includes all apparel merchandise for Oct 1 – 22nd.Source: Centric Market Intelligence Co.
Despite higher discounts, customer’s appetite for Halloween costumes has remained level with last year’s strong demand. October to-date, 8% of the Halloween apparel online is completely sold out, which is still higher than its pandemic (6%) and pre-pandemic levels (3%) (Exhibit 2).
Exhibit 2: October Sold-Out Rates 2019 – 2023 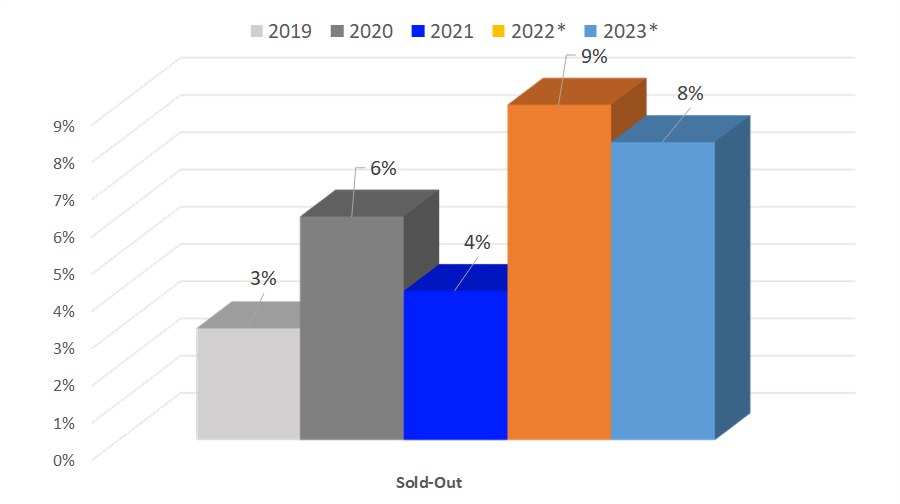 *2023: This includes all apparel merchandise for Oct 1 – 22nd.Source: Centric Market Intelligence Co.
On the flip side, the average discount penetration — the percentage of Halloween décor merchandise on sale — has declined to 48% vs. last year’s 51%, but the current figure is still higher than the pre-pandemic level of 44% (Exhibit 3).The average discount is also slightly lower this year going into the holiday weekend, as retailers try not to hurt their margins too much in the face of higher inflation. For procrastinators, this means about the same home decoration discounts compared to previous Halloweens.
Exhibit 3: Avg Discount & Discount Penetration for Halloween Home Decorations 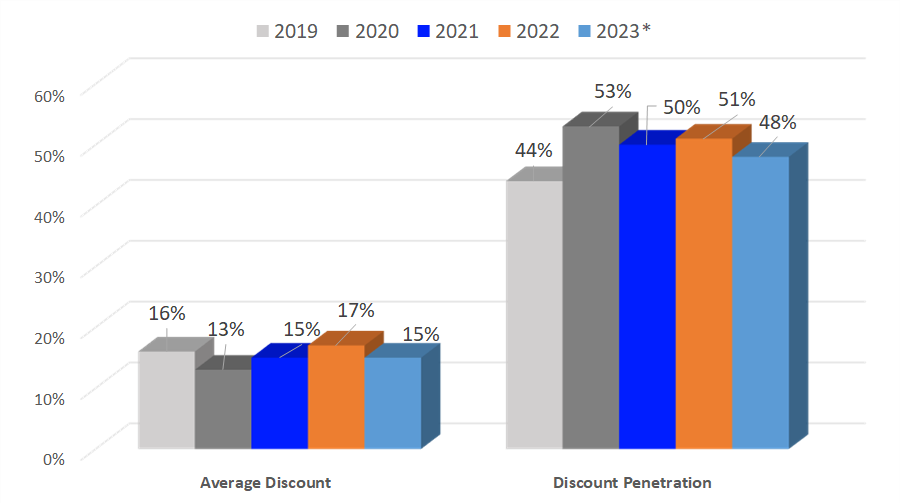 *2023: This includes all apparel merchandise for Oct 1 – 22nd.Source: Centric Market Intelligence Co.
Trick or treat goodies
Those chocolates in the trick or treat bags may be costing more. The main chocolate ingredient, cocoa, saw a price jump to $3,735 per metric ton (the last closing price as of this writing). That is up 64% compared to a year ago, which could lead to higher chocolate prices or smaller Halloween candy bars. So far, the higher prices don’t seem to be hindering demand at candy makers Mondelez International and Hershey.Mondelez International, the maker of Sour Patch and Cadbury chocolate, is on track to post an 8.6% growth in earnings and 7.4% growth in revenue for Q4 2023, which is the quarter including the Halloween holiday. This would mark its strongest showing so far, as the candy maker is on track to post its 14th straight quarter of positive growth. It also suggests that its candy continues to be a favorite during the Halloween season (Exhibit 4).
Exhibit 4: Mondelez Revenue and Earnings Results/Estimates: 2019 – 2023 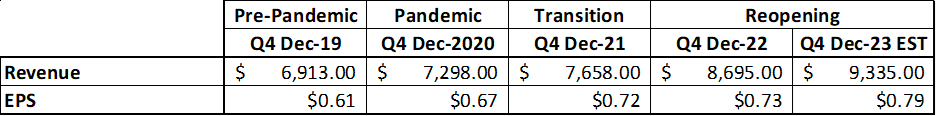 Revenues in $millions. Source: LSEG I/B/E/S dataSimilarly, for Q4 2023, Hershey is on track also to post 14 straight quarters of positive revenue growth, and stronger revenues compared to its pandemic and pre-pandemic levels (Exhibit 5). Q4 earnings at the legendary chocolate maker are expected to show a 4.7% growth from last year’s robust Halloween sales when earnings grew 19.5%.
Exhibit 5: Hershey Revenue and Earnings Results/Estimates: 2019 – 2023 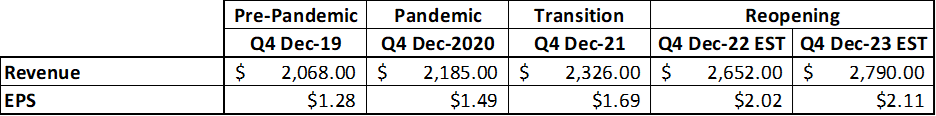 Revenues in $millions. Source: LSEG I/B/E/S dataThe chocolate maker is in the top quartile of the Earnings Quality model. The StarMine Score for Hershey is 81, suggesting earnings are coming from sustainable sources. (Exhibit 6). What’s more, the Credit Text Mining and Structural Models are all in the top decile.The Credit Text Mining Model applies sophisticated text mining algorithms to Workspace’s company events: conference-call transcripts, financial statements and other regulatory filings, Reuters News and select broker research reports to identify language that is predictive of credit risk.Hershey scores a strong 91 on this model. However, its Credit Risk Smart Ratio is not as strong and suggests its leverage ratios could use some improving. Still, the Credit Structural Model score of 94 suggests that the company is unlikely to default on its debt obligation over the next one-year period.
Exhibit 6: Hershey’s StarMine Model Scores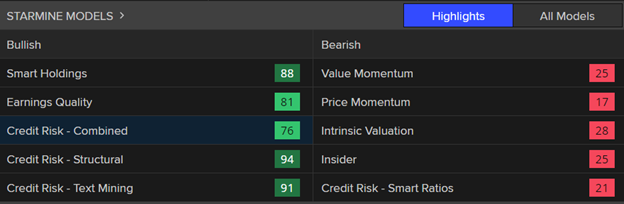
Source: LSEG StarMine
Tootsie Roll Industries
Tootsie Roll is another favorite Halloween candy and has been in business for over a century.This year however, its stock price has been down 28.7%, and for the most part has generally underperformed the S&P 500. Moreover, StarMine’s Price Momentum Model (Price Mo) shows that Tootsie Roll’s performance in this area is below most of its peers (Exhibit 7).On the flip side, the company performs much better in its Credit models. It scores an 88 out of a possible 100 in the Credit Smart Ratios model.This is the most comprehensive StarMine credit model, as it combines the power of StarMine’s three credit risk models – the StarMine Text Mining Credit Risk Model, the StarMine SmartRatios Credit Risk Model and the StarMine Structural Credit Risk Model – to generate our single, final estimate of public company credit risk.
Exhibit 7: Tootsie Roll StarMine Model Scores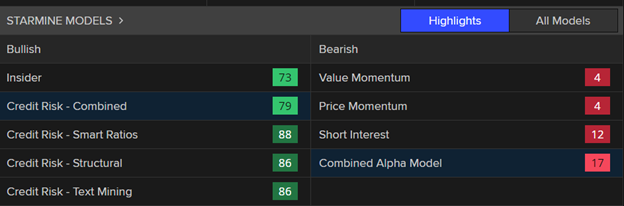 Source: LSEG StarMineMore By This Author:UniCredit’s Surge Is A Pipe Dream For Barclays
S&P 500 Earnings Dashboard 23Q3 – Wednesday, Oct. 25
STOXX 600 Earnings Outlook 23Q3 – Tuesday, Oct. 24


Leave A Comment